Download
1 / 42
420 likes | 529 Vues
Searching the missing young stellar population within the Galactic Center. H. Dong, Q. D. Wang, D. Calzetti (umass), A. Cotera (SETI), S. Stolovy, M. Muno, J. Mauerhan (Caltech/IPAC/JPL), C. Lang (U. of Iowa), M. Morris, B. Mills (UCLA), G. Schneider (U. Arizona) Oct 20 th , 2009

E N D
Searching the missing young stellar population within the Galactic Center H. Dong, Q. D. Wang, D. Calzetti (umass), A. Cotera (SETI), S. Stolovy, M. Muno, J. Mauerhan (Caltech/IPAC/JPL), C. Lang (U. of Iowa), M. Morris, B. Mills (UCLA), G. Schneider (U. Arizona) Oct 20th, 2009 2009 Galactic Center workshop, Shanghai
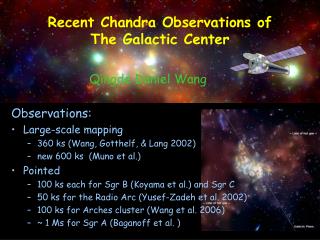
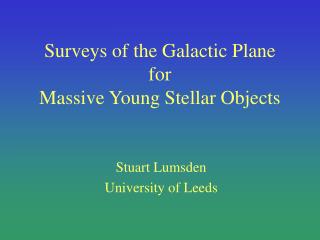
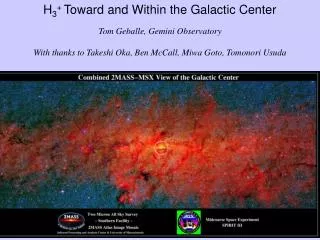
2MASS GC image Introduction • GC,~8kpc, the best lab to study the interaction between SMBH and its environment
Molecular cloud SMBH Fuel SMBH Star SMBH Provide the energy
2MASS GC image Introduction • GC,~8kpc, the best lab to study the interaction between SMBH and its environment • Star formation’s effect on the SMBH Old molecular cloud mom
2MASS GC image Introduction • GC,~8kpc, the best lab to study the interaction between SMBH and its environment • Star formation’s effect on the SMBH • Big puzzle: The star formation mode High T, strong magnetic field (several microgauss) and strong tidal forces!!!!!!!!!!! Old molecular cloud mom
Figer et al 1999 2MASS GC image Introduction • GC,~8kpc, the best lab to study the interaction between SMBH and its environment • Star formation’s effect on the SMBH • Big puzzle: The star formation mode • Three clusters within GC, Arches, Quintuplet and Center How do they form!!!!!!
The Key Questions • How do the clusters form?
The Key Questions • How do the clusters form? • What are their properties? • Arches and Center show top-heavy IMF (Stolte et al. 2005, Paumard et al 2006)
The Key Questions • How do the clusters form? • What are their properties? • How do they shape the ISM within GC
The Key Questions • How do the clusters form? • What are their properties? • How do they shape the ISM within GC • The star formation history within GC More young star clusters are needed !!!!!!!!!!!!!!!!!!!!!!!!!!!!!!!!!!!!!!!!!!!!!
HST Galactic Center Pa α Survey • Why Pa α ? • Trace the young stellar population directly, low stellar background • In the near-IR band • 3-4 times brighter than Brγ, even with the strong extinction • Why HST/NICMOS NIC3? • High Angular resolution, ~0.2” • Large Field View~1’ ×1’ • Low instrument background • Without the affect from atmosphere • Stable PSF
HST Galactic Center Pa α Survey • HST/NIC3 • F187N (on line) and F190N (off line) • MULTI-ACCUM exposures • 4-point half pixel dithering, large spatial shifts (6.09”) among dithering exposures • 192 s per each position and filter
Arches Sgr A* Quintuplet 144 orbits, ~416 arcmin^2, systematic around Sgr A* ~15’, 35 pc Spitzer 8 micron dust only image (PAH), from Susan Stolovy ~39’, 90 pc
F187 Mosaic F190 Mosaic
Source Detection • ‘Starfinder’, ~0.6 million point sources • 50% completeness limit varies from 80 uJy (17.5 mag) to 500 uJy (15.5 mag) • 85% star light in F190N have been resolved
Result 1: Which kind of sources we are looking on • Magnitude distribution • Defining foreground sources with F1.87/F1.90>1.07, i.e. H-K<1 • The peak around 15.5 should not be due to the detection limit • What is the origin of this component?????
Result 1: Which kind of sources we are looking at • Padova Stellar track (Girardi et al. 2000) • ATLAS 9 atmosphere model (Castelli et al. 1997)
Result 1: Which kind of sources we are looking on • The bright stellar peak around 15.5 magnitude represents AGB/RGB with 1-3 solar mass • They distribute in a disk-like structure • Sjouwerman et al 1999, OH/IR masers, median expansion velocities, a starburst activities > 1 Gyr ago
Result 3: Pa αemitting sources – the tracer of the missing star clusters • Massive stars in the transient phase, such as, O If, Luminous Variable Blue (LBV), Wolf-Rayet (WN and WC) • Selecting out Pa αemitting sources by considering the local extinction and photometric error • ~160 sources • We recover most of the spectroscopy identified massive stars within the three clusters (~65 sources) • Most of them are WN and OIf, then WC, and 3 WNE
Star formation doesn’t constrain on the three massive star clusters!!!!!!!!!!!!!!!!!!!!!!!!!!!!!!!!!!!!!!!!!
Summary • We construct the first big mosaic of the Pa αemission within GC with high angular resolution~0.2” • We detect 0.6 million sources • We found the RGB/AGB in the nuclear disk • 160 Pa αsources have been detected, 50% are outside of the three well know star clusters • Many new extended emissions
Future Work • Compared with the Padova stellar mode to understand the age and star formation history of the nuclear disk • Construct an extinction map • Reconstruct the stellar distribution model of the nuclear disk and nuclear bulge • Study the stellar properties of the new HII regions • The properties of the ISM in the ionization fronts
Collaborators Caltech Susan Stolovy Jon Mauerhan Solange Ramirez Michael Muno Umass Daniel Wang Daniela Calzetti SETI Angela Cotera Arizona Glenn Schneider UCLA Mark Morris Betsy Mills Univ. of Iowa Cornelia Lang
2MASS GC image Introduction • GC, the best place to study the interaction between SMBH and its environment GC M31
Cotera et al 1999 The Key Questions • How do the clusters form? • What are their properties? • How do they shape the ISM within GC
Demonstration for one position, left: using our method, right: using the traditional ‘Pedsub’ method Data Analysis • Basic pipeline • Overlap field, global solution to correct the relative background and astrometry among exposures, positions and orbits
Data Analysis • Basic pipeline • Source Detection • Creating the PSF from 42 brightest sources • ‘Starfinder’, ~0.6 Million point sources • 50% completeness limit varied from 80 uJy (17.5 mag) to 500 uJy (15.5 mag) • 85% star light in F190N have been resolved
Data Analysis • Basic pipeline • Overlap field, global solution to correct the relative background and astrometry among exposures, positions and orbits
Foreground molecular clouds F187 Mosaic F190 Mosaic
Data Analysis • Basic pipeline • Overlap field, global solution to correct the relative background and astrometry among exposures, positions and orbits • Absolute background, foreground molecular clouds • Absolute astrometry, 11 SiO Masers
Data Analysis • Basic pipeline • Source Detection • ‘Starfinder’, ~0.6 million point sources • 50% completeness limit varies from 80 uJy (17.5 mag) to 500 uJy (15.5 mag) • 85% star light in F190N have been resolved
Data Analysis • Basic pipeline • Source Detection • ‘Varial Scale method’ (Scoville et al 2003) to produce the Pa α image for each position • Creating a ratio map
Result 1: Which kind of sources we are looking on • Magnitude distribution • Defining foreground sources with F1.87/F1.90>1.07, i.e. H-K<1 • The peak around 15.5 should not due to the detection limit • What is the origin of this component?????
Result 3: Pa αemitting sources – the tracer of the missing star clusters • 60% are within the well know three clusters, 40% are field • More sources in the left side • Most of these sources should not belong to the three massive star clusters • Dynamics information are needed for these sources