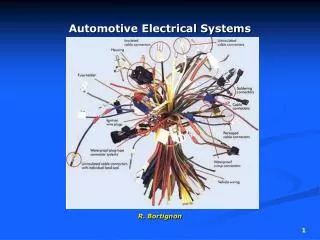
Electrical Systems
Electrical Systems. Electrical Systems. This section discusses: How utilities charge for electricity How to calculate the avoided cost of electricity How to use utility billing analysis to help identify cost saving opportunities. Electric Rate Structures.


Electrical Systems
E N D
Presentation Transcript
Electrical Systems • This section discusses: • How utilities charge for electricity • How to calculate the avoided cost of electricity • How to use utility billing analysis to help identify cost saving opportunities
Electric Rate Structures • Total cost of electricity in most rate structures is the sum of: • Service charge • Energy charge • Demand charge • Power factor charge
Energy Charge • Based on total energy (kWh) consumed over entire month • Charge typically uses block structure with decreasing unit cost for larger amounts • Fixed Blocks • $0.05 /kWh for the first 10,000 kWh • $0.04 /kWh for the next 100,000 kWh • $0.03 /kW for all remaining kWh • Demand-dependent Blocks • $0.05 /kWh for first 250 kWh/kW • $0.04 /kWh for next 150 kWh/kW • $0.03 /kWh for all additional kWh • Fuel Cost Adjustments and Taxes: • Because the cost of fuel for a utility may vary over time, utilities sometimes modify the energy costs in the rate schedule with a “fuel cost adjustment”.
Demand Charge • In addition to measuring total energy consumed over entire period, also measuring energy consumed over every 15 or 30-minute period during month. Find period with max energy use, convert to rate (kW), and charge monthly fee. • Demand charge may use block structure with decreasing unit cost for larger amounts • $15.00 /kW for the first 100 kWh • $12.00 /kW for all remaining kW • On Peak - Off Peak Rates: • ‘billing demand’ is calculated as the greater of: • the actual on-peak demand, or • 50% of the actual off-peak demand. • Seasonal Demand Charge: • the actual demand, or • 75% of the peak monthly demand during the previous 12 months.
Power Factor Charge • In inductive loads (i.e. motors), voltage lags current making some power unusable: reactive power (kVAr) • Supplied power (kVA) must compensate for reactive (kVAr) and usable (kW) power. • Power factor is ratio of usable power (kW) to supplied power (kVA) • Most utilities charge for low power factor since supplied power (kVA) > useable power (kW)
Example Rate Structure 1 • Service: • $95 /month • Energy: • $0.021 /kWh • Demand: • $13.86 /kW-month • Greatest average power during any 30-minute period • Greatest of: • 100% of on-peak (weekdays: 8 am to 8 pm) • 75% of off-peak (all other times) • 75% of max Jun, Jul, Aug, Dec, Jan, Feb in last 11 months • Power Factor: • $0.30 /kVAr-month
Example Rate Structure 2 • Service: $100 /mo • Energy: $0.026 /kWh for first 250 kWh/kVA • $0.011 /kWh for all additional kWh • Demand: $18.36 /kVA-mo for first 4,000 kVA: • $14.45 /kVA-mo for all additional kVA • Greatest average power during any 15-minute period • Power factor: Implicit in kVA
Interpreting Electricity Billing Data Use graphical analysis!
Electrical System Cost Saving Opportunities • Billing Errors • Reconcile billing error with utility • Meter Consolidation • Consolidate electrical meters • Purchasing Transformer • Purchase transformer and switch to primary service • Power Factor Correction • Correct power factor by downsizing over-sized motors • Correct power factor by adding capacitors • Demand Saving Potential • Reschedule operation of electrical equipment to reduce peak demand. • Use control equipment to shed loads to manage peak demand • Demand Response Program • Voluntarily reduce demand during demand emergency
Meter Consolidation 2 Meters: ED = 80 + 50 = 130 kW 1 Meter: ED = 100 kW
Purchase Transformer And Switch To Primary Service • Primary Service: customer owns and maintains the transformer • Secondary Service: utility owns and maintains the transformer • Lower electricity rates for primary service, since the customer must purchase and maintain the transformer. • Advantageous for customer to purchase transformer when demand > 1,000 kVA.
Correct Power Factor Low PF has three adverse effects: Utilities charge for low PF Increased supplied power (kVA) increases line losses, line size, transformer size May cause sensitive electrical equipment to malfunction. Good practice to maintain PF > 90% by Right-sizing under-loaded motors Adding capacitors that absorb kVAr, decrease kVA and increase PF
Demand Saving Potential Low potential for 1-shift and 3-balanced shift operations
Demand Saving Potential Good potential for uneven shifts
Demand Saving Potential 20 kW potential limited by first shift demand to 10 kW
Demand Saving Potential Savings larger with “off-peak demand rates”: Savings = 500 kW for moving demand from 1st to 2nd shift Savings = 1,000 kW for moving demand from 1st to 3nd shift
Stagger Startup of Barrel Heaters Sunday barrel pre-heat would set peak if hydraulic motors on during startup.
Demand Response Programs • Many utilities and independent companies offer demand response programs • Demand response compensates customers for having ability and willingness to curtail load during critical times on the grid. • Demand response payments ~ $50 /kW-year. • No “demand emergencies” in 13-state PJM territory in last two years. • Example: agree to reduce demand by 100 kW and receive ~ $5,000 per year.