Position-Time Graphs: Interpreting Motion and Finding Intersections
Learn how to develop position-time graphs, interpret object position/displacement, and find intersections between multiple objects. Equivalent representations, such as motion diagrams and data tables, are explored.

Position-Time Graphs: Interpreting Motion and Finding Intersections
E N D
Presentation Transcript
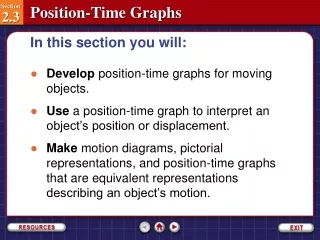
In this section you will: • Develop position-time graphs for moving objects. • Use a position-time graph to interpret an object’s position or displacement. • Make motion diagrams, pictorial representations, and position-time graphs that are equivalent representations describing an object’s motion. Section 2.3-1
Position-Time Graphs Click image to view movie. Section 2.3-2
Using a Graph to Find Out Where and When Graphs of an object’s position and time contain useful information about an object’s position at various times. It can be helpful in determining the displacement of an object during various time intervals. Section 2.3-3
Using a Graph to Find Out Where and When The data in the table can be presented by plotting the time data on a horizontal axis and the position data on a vertical axis, which is called a position-time graph. Section 2.3-4
Using a Graph to Find Out Where and When To draw the graph, plot the object’s recorded positions. Then, draw a line that best fits the recorded points. This line represents the most likely positions of the runner at the times between the recorded data points. The symbol d represents the instantaneous position of the object—the position at a particular instant. Section 2.3-5
Equivalent Representations Words, pictorial representations, motion diagrams, data tables, and position-time graphs are all representations that are equivalent. They all contain the same information about an object’s motion. Depending on what you want to find out about an object’s motion, some of the representations will be more useful than others. Section 2.3-6
Considering the Motion of Multiple Objects In the graph, when and where does runner B pass runner A? Section 2.3-7
Considering the Motion of Multiple Objects Step 1: Analyze the Problem Section 2.3-8
Considering the Motion of Multiple Objects Restate the question. At what time do A and B have the same position? Section 2.3-9
Considering the Motion of Multiple Objects Step 2: Solve for the Unknown Section 2.3-10
Considering the Motion of Multiple Objects In the figure, examine the graph to find the intersection of the line representing the motion of A with the line representing the motion of B. Section 2.3-11
Considering the Motion of Multiple Objects These lines intersect at 45.0 s and at about 190 m. Section 2.3-12
Considering the Motion of Multiple Objects B passes A about 190 m beyond the origin, 45.0 s after A has passed the origin. Section 2.3-13
Considering the Motion of Multiple Objects The steps covered were: The steps covered were: Step 1: Analyze the Problem Restate the questions. Step 2: Solve for the Unknown Section 2.3-14
Question 1 A position-time graph of an athlete winning the 100-m run is shown. Estimate the time taken by the athlete to reach 65 m. A. 6.0 s B. 6.5 s C. 5.5 s D. 7.0 s Section 2.3-15
Answer 1 Reason:Draw a horizontal line from the position of 65 m to the line of best fit. Draw a vertical line to touch the time axis from the point of intersection of the horizontal line and line of best fit. Note the time where the vertical line crosses the time axis. This is the estimated time taken by the athlete to reach 65 m. Section 2.3-16
Question 2 A position-time graph of an athlete winning the 100-m run is shown. What was the instantaneous position of the athlete at 2.5 s? A. 15 m B. 20 m C. 25 m D. 30 m Section 2.3-17
Answer 2 Reason:Draw a vertical line from the position of 2.5 m to the line of best fit. Draw a horizontal line to touch the position axis from the point of intersection of the vertical line and line of best fit. Note the position where the horizontal line crosses the position axis. This is the instantaneous position of the athlete at 2.5 s. Section 2.3-18
Question 3 From the following position-time graph of two brothers running a 100-m dash, at what time do both brothers have the same position? The smaller brother started the race from the 20-m mark. Section 2.3-19
Answer 3 Answer: The two brothers meet at 6 s. In the figure, we find the intersection of lines representing the motion of one brother with the line representing the motion of other brother. These lines intersect at 6 s and at 60 m. Section 2.3-20