Practical Guide to Multi-Analyte LC-MS/MS Methods
300 likes | 462 Vues
Explore the best practices in multi-analyte LC-MS/MS methods, covering optimization, validation, specificity, stability studies, data quality checks, and conclusions. Learn about instrumentation, MS optimization, isotopic distribution, selectivity, matrix effects, and method validation criteria.

Practical Guide to Multi-Analyte LC-MS/MS Methods
E N D
Presentation Transcript
Multi-Analyte LC-MS/MS Methods – Best Practice. Martin Danaher
Contents • LC-MS/MS Overview • LC-MS/MS Optimisation • Method Validation • Specificity and selectivity • Stability studies • WLr and WLR • Data quality checks • Conclusions
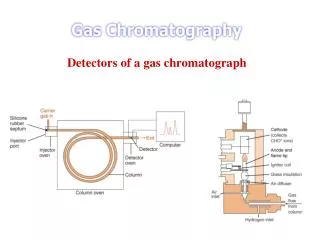
LC-MS/MS Overview Sample manager Column oven Injector Pumps MS/MS (QqQ) 3 3
LC-MS/MS instrumentation (HT) Column manager: 4 columns Sample organizer: 10 trays Injector : 48 positions
MS Optimisation • MS Optimisation • Rafoxanide: EF = C19H11Cl2I2NO3 • MW: 626.01 g/mol (average value) • Monoisotopic 624.820496 • Which polarity? • Optimum cone voltages • ESI voltage • Temperatures
Information sources http://www.sisweb.com/mstools/isotope.htm
MS/MS Optimisation • Collision induced dissociation with inert gas e.g. N2 or Argon. • Identify most abundant?? daughter or product ions • Product ions must be selective • Avoid neutral losses -18 (H2O) and -17 (OH) • Avoid non-specific fragments: 91 m/z, 105 m/z and 121 m/z. • Consult literature, see what others are using.
Chromatographic development • Generic scouting gradient • M. Phase A 100% Aqueous • M. Phase B Acetonitrile or Methanol • Column: 100 × 2.1 mm • Inject each mix at high concentration and optimise separation • Evaluate the impact of different additives acids and salts • Optimise additive concentrations
Specificity – Similar compounds • Inject analyte standard and internal standard separately (highest concentration). • Check for interference in each analyte or IS trace • Isobaric interference • Cross-talk • Carry-over
Selectivity – Matrix components • HPLC-FLD separation of analyte from the matrix peak.
Selectivity – Matrix components • LC-MS/MS – Matrix peaks not visible • Co-eluting peaks, late eluting peaks, etc. • Ion suppression or enhancement • Potential Solutions: • Clean-up • Chromatographic separation • Matrix matched standards • SILs
Matrix Effects Study – Approach I • Post-column infusion of standards with blank matrix samples
Matrix Effects Study – Approach II • Spike a range of representative samples post extraction and compare with solvent standards. • Calculate enhancement or suppression effects • Calculate the precision • Evaluate the impact of the use of internal standards
Method Validation • Stability studies • Standard stability (3, 6, 12, 24, 36 months). Different storage conditions. • Sample extracts – intermediate or in final injection solvent. Over 7 days or continuous injection • Stability in matrix – spike samples and store for different periods of time (1, 2, 3, 4, 6, 8, 12, 26, 52 weeks) • Limit of detection • Limit of quantitation/Limit of Reporting
Method Validation • Within laboratory repeatability • 18 samples spiked at three different levels • Repeat by the same analyst • Within laboratory reproducibility • Minimum of 18 “different” samples spike at three different levels • Repeat on different days by the different analysts. • Use different equipment if possible. • CCα • Calculate using WLR data.
Data quality Checks (qualitative) • Identification • RT (5%)/RRT (2.5%) • S/N >3 • Identification points (3 or 4) • Ion ratio
Data quality Checks (quantitative) • CCα • Compare CCα with MRL. Big gap more precise method needed. • Calibrations • Use weighted linear regression not through (0,0) • Inject at start and end of batch. Drift <30%. • Inject LOQ as a response check throughout the run. Drift <30%. • Residuals ±20%. • Minimum of five points on curve.
Data quality Checks (quantitative) • Trueness • Precision For analyses carried out under repeatability conditions, the intra-laboratory CV would typically be between ½ and 2/3 of the above values.
Conclusions • SANCO validation document presents complementary validation guidelines. • Provides more practical information on routine analysis • Interpretation of data quality. • Elements in 2002/657/EC validation that should be retained. • Good ideas e.g. Ccα • Ambiguity around the validation approach • Considered as being inflexible.