Download
1 / 23
230 likes | 253 Vues
Learn different types of functions, including linear, quadratic, and exponential, with examples and how to graph and interpret data using patterns.

E N D
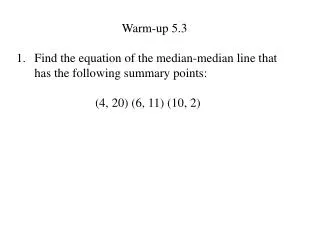
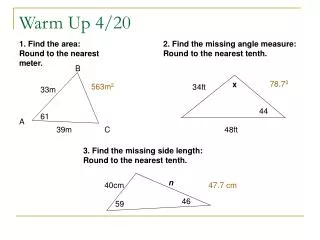
Warm Up Find the slope and y-intercept of the line that passes through (4, 20) and (20, 24).
11-4 Linear, Quadratic, and Exponential Models Holt Algebra 1
The table and the graph show an insect population that increases over time.
A function rule that describes the pattern above is f(x) = 2(3)x. Notice that 2 is the starting population and 3 is the amount by which the population is multiplied each day. This type of function, in which the independent variable appears in an exponent, is an exponential function.
Example 1A: Evaluating an Exponential Function The function f(x) = 500(1.035)x models the amount of money in a certificate of deposit after x years. How much money will there be in 6 years? f(x) = 500(1.035)x Write the function. Substitute 6 for x. f(6) = 500(1.035)6 Evaluate 1.0356. = 500(1.229) = 614.63 Multiply. There will be $614.63 in 6 years.
+ 1 3 3 + 1 3 + 1 Example 2A: Identifying an Exponential Function Tell whether each set of ordered pairs satisfies an exponential function. Explain your answer. {(0, 4), (1, 12), (2, 36), (3, 108)} This is an exponential function. As the x-values increase by a constant amount, the y-values are multiplied by a constant amount.
• • • • Example 3: Graphing y = abx with a > 0 and b > 1 Graph y = 0.5(2)x. Choose several values of x and generate ordered pairs. Graph the ordered pairs and connect with a smooth curve.
• • • Check It Out! Example 4a Graph y = –6x. Choose several values of x and generate ordered pairs. Graph the ordered pairs and connect with a smooth curve.
Check It Out! Example 6 An accountant uses f(x) = 12,330(0.869)x, where x is the time in years since the purchase, to model the value of a car. When will the car be worth $2000? Enter the function into the Y = editor of a graphing calculator.
Look at the tables and graphs below. The data show three ways you have learned that variable quantities can be related. The relationships shown are linear, quadratic, and exponential.
Look at the tables and graphs below. The data show three ways you have learned that variable quantities can be related. The relationships shown are linear, quadratic, and exponential.
Look at the tables and graphs below. The data show three ways you have learned that variable quantities can be related. The relationships shown are linear, quadratic, and exponential.
Example 1A: Graphing Data to Choose a Model Graph each data set. Which kind of model best describes the data? Plot the data points and connect them. The data appear to be exponential.
Example 1B: Graphing Data to Choose a Model Graph each data set. Which kind of model best describes the data? Plot the data points and connect them. The data appears to be linear.
Check It Out! Example 1a Graph each set of data. Which kind of model best describes the data? Plot the data points. The data appears to be exponential.
Check It Out! Example 1b Graph each set of data. Which kind of model best describes the data? Plot the data points. The data appears to be quadratic.
Remember! • When the independent variable changes by a constant amount, • linear functions have constant first differences. • quadratic functions have constant second differences. • exponential functions have a constant ratio.
+ 1 + 64 –32 + 1 + 32 –32 + 1 0 –32 + 1 –32 Example 2A: Using Patterns to Choose a Model Look for a pattern in each data set to determine which kind of model best describes the data. Height of golf ball For every constant change in time of +1 second, there is a constant second difference of –32. The data appear to be quadratic.
1.17 + 1 + 1 1.17 + 1 1.17 Example 2B: Using Patterns to Choose a Model Look for a pattern in each data set to determine which kind of model best describes the data. Money in CD For every constant change in time of + 1 year there is an approximate constant ratio of 1.17. The data appears to be exponential.
+ 1 – 9 + 1 + 6 – 3 + 1 + 6 + 3 + 1 + 6 + 9 Check It Out! Example 2 Look for a pattern in the data set {(–2, 10), (–1, 1), (0, –2), (1, 1), (2, 10)} to determine which kind of model best describes the data. For every constant change of +1 there is a constant ratio of 6. The data appear to be quadratic.
After deciding which model best fits the data, you can write a function. Recall the general forms of linear, quadratic, and exponential functions.
Lesson Quiz: Part I Which kind of model best describes each set of data? 1. 2. quadratic exponential
Lesson Quiz: Part II 3. Use the data in the table to describe how the amount of water is changing. Then write a function that models the data. Use your function to predict the amount of water in the pool after 3 hours. Increasing by 15 gal every 10 min; y = 1.5x + 312; 582 gal