Download
1 / 23
240 likes | 312 Vues
Learn how to convert SUTs to I-O tables for coherence in GDP estimates, understanding industry-product relationships, and analytical purposes. Presentation covers steps, technology assumptions, and data requirements.

E N D
Chapter 11: Supply and use tables to input-output tables Ramesh KOLLI EN/SUT/2014/Pres/05 Senior Advisor on National Accounts, African Centre for Statistics At Expert Group Meeting on Supply and Use Tables 2-6 June 2014, Port Louis, Mauritius Le Méridien Ile Maurice
Outline of Presentation • Introduction • From rectangular SUTs-pp to square SUTs-pp • From square SUTs-pp to square SUTs-bp • Matrices of trade and transport margins • Matrices of taxes and subsidies • From Use Table-bp to • Use table of domestic intermediates • Use table of imported products • Transformation process from SUT to IO tables • Why transformation process is required • Requirement of data • Technology assumptions and transformation models
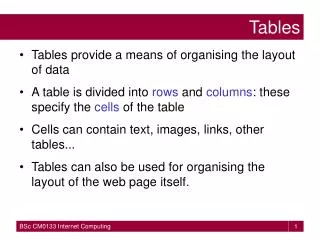
1. Introduction • SUTs ensure consistency between various data sources available • provide coherence to the GDP estimates • The use table shows • that each industry consumes a certain mix of products in order to produce its output, and • that each product is sold to a variety of domestic industries and final users. • However, for analytical purposes, transformation from SUTs to a single I-O table where row and column totals are equal, is necessary • This is done through various steps: • Converting rectangular SUTs to square SUTs at purchasers’ prices • Preparation of use matrices for trade and transport margins and taxes less subsidies on products • Conversion of square SUTs at purchasers’ prices to square SUTs at basic prices • Preparation of a matrix of uses of imports • Converting SUTs at basic prices to IO tables
Making SUTs square with products corresponding to industries • Procedures involved in converting rectangular SUTs to square SUTs are to (a) disaggregate or aggregate the products; or (b) disaggregate or aggregate the industries. • In either option, products will correspond to industries in resultant square SUT • The choice of the two options, depends on the size of the I-O table to be compiled from the SUTs. • The size of I-O will be larger if industries are dis-aggregated to match products, as products are generally more than industries in rectangular SUTs. • The size of I-O will be smaller if products are aggregated to match industries. • Generally it is preferable to follow the aggregation approach, as disaggregation requires lot more efforts in collecting detailed data and the compilations involved will almost be equivalent to compiling the SUTs afresh.
Making SUTs square (2) • SUTs use ISIC and CPC classifications or country-specific classifications based on ISIC and CPC • Standard concordance tables are available between ISIC and CPC on the UNSD website. • Using these concordance tables, the square SUTs at purchasers’ prices can be prepared from the rectangular SUTs at purchasers’ prices, in which • industry classification and the product classification are fully aligned with each other, • industries and products correspond to each other and • the number of industries and the number of products are the same
Use table at BP (2) • Each cell value in quadrant I and quadrant II at purchasers’ prices include values at basic prices, trade margins, transport costs and taxes less subsidies on products in an integrated manner. • For the use table at basic prices, each of these components need to be segregated from these cell values and placed in the respective rows of trade, transport and taxes less subsidies on products. • While the trade and transport rows already existing in the use table will now include the total values segregated from the corresponding cells in the same columns, a separate row needs to be introduced for taxes less subsidies on products at the end of the product rows, as intermediate consumption of industries would still need to be valued at purchasers’ prices.
Use table at BP (3) • Trade and transport margins are estimated for the supply table. • We now need to estimate corresponding valuation matrices for the use side. • The trade and transport margin matrix needs to be prepared by looking at various data sources and may also need assumptions • One such simple assumption - For trade and transport margins as for taxes less subsidies on products, it is assumed that the output structure of the use table at purchasers’ prices can be used to estimate the valuation matrices. • With this assumption, separate matrices for trade and transport margins are compiled for the trade and transport services, as also for taxes less subsidies on products. • It should be noted that the columns totals for the trade and transport margin matrices always sum up to zero, as there is no trade activity at purchasers’ prices.
Use table at BP (4) • The use table at basic prices is prepared as: • use table at purchasers’ prices - use table of TTMs - use table of taxes on products + use table of subsidies • For the balanced SUTs at basic prices the following identities hold: • Output of domestic industries (supply table) = Output of industries (use table) • Supply of products (supply table) = Use of products (use table) • GDP = Gross Value added + Taxes less subsidies on products • GDP = Final Consumption + Gross capital formation + Exports – Imports
Use table of domestic output • The balanced SUTs at BP are required for transformation into symmetric I-O table. • However for economic analysis, the use table could be separated into (i) use table of domestic output and (ii) use table of imports. • The main reason for this separation is to assess the economic impacts on the domestic industries in the economic analysis. • The next task, therefore, is to separate the use table at basic prices into • Use table for domestic intermediates at basic prices; and • Use table of imports at basic prices.
Use table of imports • In the supply table, imports are shown by products separately, but not in use table. • Therefore, cell values in the use table at BP include values from imported and domestic sources together. • However, a vector for imports is given in the supply table at basic prices. • For the compilation of a use table of imports, this vector is used, assuming that the output structure for products in the use table at basic prices is also valid for the import matrix. • In other words, it is assumed that industries and final users in the economy have no specific preference towards domestic and imported products. • Intermediate inputs in the use table at basic prices reflect intermediates which are required for a specific technology, disregarding their origin (domestic or imported). • The use table of domestic output is calculated as: • Use table at basic prices – use table of imports • The column totals of use table of imports are, however, shown in a separate row in the use table of domestic output, as total inputs need to match with total output.
Transformation process (1) • The symmetric I-O table is a square table that has • either products or industries in both its rows and columns. • The symmetric I-O table is similar to the structure of use table • It is compiled by merging the fully balanced square supply table at basic prices with the corresponding use table at basic prices. • The resultant matrix is a use table of either product X product type or industry X industry symmetric type • column total equals that of row total for each product/industry • The symmetric I-O table is further used in the derivation of analytical I-O matrices, such as the Leontief inverse, and the construction of I-O models
Transformation Process (2) • The transformation process involves either • columns (industries) in the two left-most quadrants in the use table at basic prices are replaced by products; or • products in the two top-most quadrants are replaced by industries. • The resulting intermediate consumption (inter-industry use) matrix becomes square, showing either (i) products in both rows and columns or (ii) industries in both. • In both cases, row totals for the complete matrix match with the column totals for the complete matrix, product by product or industry by industry as the case may be. • The resulting matrices are referred to as being symmetric. • Therefore, in order to reduce the SUTs to one single I-O matrix two possibilities exist - to express the I-O table in terms of products or in terms of industries.
Why transformation process is required • The reason that manipulation of SUTs to produce an I-O table is existence of secondary products. • There are three types of secondary production: • Subsidiary products: those that are technologically unrelated to the primary product; • By-products: products that are produced simultaneously with another product but which can be regarded as secondary to that product; • Joint products: products that are produced simultaneously with another product that • cannot be said to be secondary (for example beef and hides). • If number of industries and products are same, and if each industry only produced one product, then • supply table for the domestic economy is unnecessary; • the column totals for industries would be equal to the row totals for products • inter-industry matrix would be square.
Requirement of data • For the transformation process: • SUTs at basic prices form the requisite database • Supply table at basic prices • Use table at basic prices • Use table of domestic output at basic prices • Use table of imports
Technology assumptions and transformation models • For compiling I-O tables, it is necessary to eliminate secondary products • There are two basic approaches to eliminating secondary products: • Both come from applying information available in use table to the supply table, so that the resultant supply table is a purely diagonal one. • Once this is done, supply table contains no further useful information and is no longer presented as part of I-O table • The transformed use table is what is referred to as an I-O table. • This table also contains information of the supply table in respect of domestic production and imports separately.
Transformation process - Product by product table • Both rows and columns represent product group sectors • If the secondary products of an industry group along-with the inputs are transferred to the industry group where they are the principal products, the resulting table is a product by product I-O table. • There are two ways in which a product by product matrix can be derived: • The industry technology assumption, where each industry has its own specific means of production irrespective of its product mix. • The product technology assumption, where each product is produced in its own specific way irrespective of the industry where it is produced.
Product by product table (2) Industry technology assumption • It is assumed that the input structure of all products (both principal and secondary) of an activity is the same • This means, input structure of a particular product may differ depending on which activity is producing it. • The industry-technology assumption is always applied in conjunction with the "market share hypothesis". • It states that industries have fixed shares in the supply of products. Product technology assumption • It is assumed that input structures of a particular products is same irrespective of the activity where it is produced • Usually product technology assumption is followed for subsidiary products and industry technology assumption is appropriate for joint & by-products
Transformation process – Industry by industry table • In this table, both rows and columns represent industry group sectors comprising of a mix of different products. • There are two ways to derive industry by industry table: • The fixed product sales structure where it is assumed the allocation of demand to users depends on the product and not the industry from where it is sold. • The fixed industry sales structure where it is assumed that users always demand the same mix of products from an industry.
Basic transformation models • Product X Product - Product technology assumption (Model A) • Each product is produced in its own specific way, irrespective of the industry where it is produced. • Product X Product - Industry technology assumption (Model B) • Each industry has its own specific way of production, irrespective of its product mix. • Industry X Industry - Fixed industry sales structure assumption (Model C) • Each industry has its own specific sales structure, irrespective of its product mix. • Industry X Industry - Fixed product sales structure assumption (Model D) • Each product has its own specific sales structure, irrespective of the industry where it is produced. Options (1) and (3) may result in negative entries; options (2) and (4) do not contain any negative entries.
Steps to convert SUT bp to IO tables • Prepare product mix coefficient matrix (C Matrix) • From the supply table, each cell in a column is divided by the Total-column. • This gives the column sum of coefficients as 1 • Prepare Market share coefficient matrix (T Matrix) • From the supply table, each cell in a row is divided by the Total of the row. • This gives the row sum of coefficients as 1 • Apply the formulae as in the next slide
Formulae Product by product table • industry technology = Use matrix * transpose (C) (C′), • product technology = Use matrix * inverse (T) • C is product mix matrix (supply table, column sum=1), • T is market share matrix (supply table, row sum = 1) • In both cases, there will be no change in the final demand vectors from the use table of product by industry at basic prices, as these are already in terms of products. Industry by industry table (a) fixed product sales structure = Transpose (T) (T′) * Use matrix (b) fixed industry sales structure = Inverse (C) * Use matrix • In both cases, there will be no change in the primary inputs, from the use table of product by industry at basic prices, as these are already expressed in terms of industries.
The chapter also includes procedures to compile • Forward and backward linkages • Multipliers • Linkages between three quadrants of IO table • Shifting the entire IC to final demand • Shifting the entire IC to value added quadrant • Value added quadrant in final demand • few applications for economic analysis based on IO models • Quantity models • Price models
Thank you Ramesh KOLLI Senior Advisor on National Accounts, African Centre for Statistics At Expert Group Meeting on Supply and Use Tables 2-6 June 2014, Port Louis, Mauritius, Le Méridien Ile Maurice