Project Initiation *Project Selection (based upon commercial or non-commercial considerations)
460 likes | 668 Vues
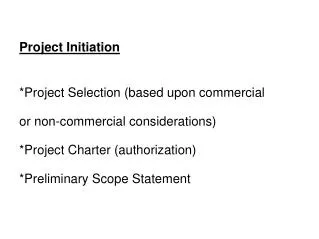
Project Initiation *Project Selection (based upon commercial or non-commercial considerations) *Project Charter (authorization) *Preliminary Scope Statement. What is Project Planning ?. It is complete road-map to go from point A to B.

Project Initiation *Project Selection (based upon commercial or non-commercial considerations)
E N D
Presentation Transcript
Project Initiation *Project Selection (based upon commercial or non-commercial considerations) *Project Charter (authorization) *Preliminary Scope Statement
What is Project Planning ? It is complete road-map to go from point A to B. Project planning is a rational determination of how to initiate, sustain, and terminate a project Project planning starts with the development of a vision - the ability to see something that is invisible to others
Why Plan a Project ? To eliminate or reduce uncertainty To improve efficiency of the operation To obtain a better understanding of the objectives To provide basis for monitoring and controlling work
Project Planning Considerations Project planning is much wider activity with following key considerations Cost estimating and budgeting Technology strategies scheduling Specification of deliverables Resource usage estimating Delineation of organizational structure Information and control system sign Risk Identification, and so on.
Project Implementation Procure Materials, Vehs, Equipt etc. Establish Field Offices (Build and test Facilities) Teams go out to work (Data Collection, survey) Develop support requirements Produce system Verify performance Modify as required, etc.
Monitoring, Control and Evaluation Discrepancies are called variances The acceptable levels of variance should be determined at the outset of the project EVA Difference between; Monitoring Control Evaluation
Termination Exit Strategy (Donors are Extremely Interested) Train functional personnel Transfer materials Transfer responsibility Release resources Reassign project team members Sustainability Aspects Warranty/ Guarantee
PROJECT PLANNING TECHNIQUES • Work Breakdown Structure (WBS) • Network Diagrams/CPM/PERT/Crashing/ Resource Levelling etc. • Gantt Chart • Earned Value Analysis
Work Breakdown Structure The Work Breakdown Structure (WBS) is a deliverable oriented grouping of the project components (products/services) which organizes and defines the total project scope.
Work Breakdown Structure • Management tool for subdividing the work into logical components. • Hierarchical structure that shows relationships of elements to each other and to the overall contract. • Organizes work into short manageable tasks. • Basis for cost and progress planning and reporting.
EXAMPLE of WORK BREAKDOWN STRUCTURE Project Level Construction Project Area Level Area A 01.00 Area B 02.00 Group Level Civil Construction A 01.01 Electromechanical A 01.02 Civil Construction B 02.01 Electromechanical B 02.02 Electrical and Control 02.02.01 Piping 02.02.02 Equipment 02.02.03 Preparation Tests 02.02.04 Electrical and control 01.02.01 Piping 01.02.02 Equipment 01.02.03 Preparation Tests 01.02.04 Earthwork 01.01.01 Foundations and Structures 01.01.02 Architectural Finishes 01.01.03 Earthwork 02.01.01 Foundations and Structures 02.01.02 Architectural Finishes 02.01.03 Work-Package Level
EXAMPLE OF WORK BREAKDOWN STRUCTURE 01.00 Area A 01.01 Civil Construction A 01.01.01 Earthwork A 01.01.02 Foundation and structures A 01.01.03 Architectural Finishes A 01.02 Electromechanical A 01.02.01 Electrical and Control A 01.02.02 Piping A 01.02.03 Equipment A 01.02.04 Preparation Tests A
BUILDING A HOUSE CONSTRUCTION OF HOUSE OUT BUILDINGS LAND SCAPING GARDEN CIVIL CARTENTER/ PLUMBER ELECTRIC/ PAINTERS GARAGE DRIVE WAY GREEN HOUSE GARDEN FENCE GROUND FOUNDA- TIONS WALLS ROOF DOORS/ WINDOW BIC PLUMBING WIRING PAINTING FINISHING
100% Rule. If not included in WBS, it is not in scope. • Planned outcomes and deliverables, not planned activities • Not list of work or activities, but classification or grouping of deliverables • Mutually exclusive elements • Progressive elaboration, or Rolling wave planning.
Estimating • Resources • Time • Costs
Project Network Diagrams • Project network diagrams are the preferred technique for showing activity sequencing. • A project network diagram is a schematic display of the logical relationships among, or sequencing of, project activities.
Approaches for Developing Networks • Activity on Arrow • Activities drawn on arrows • Nodes are used as Milestones • Dummy activities • Activity on Node • Activities drawn on Nodes • Arrows are used to represent Flow
Basic rules for Developing Networks • Network flow typically from left to right • An activity cannot begin until all preceding connected activities have been completed • Each activity should have a unique identification number • An activity identification number must be larger than that of any activities that precede it • Looping is not allowed • Conditional statements are not allowed
Work Breakdown Structure, Most Likely Durations & Precedence Relationships for a Project Most Likely Immediate Activity Duration (Weeks) Predecessor(s) A. Select computer software B. Install software C. Install office network D. Test software E. Develop database F. Train employees G. Implement system 3 5 7 6 8 3 2 A A B B C,D E,F
Comparison of Networks Requiring Dummy Activities for Activity-on-Arc Representation
Critical Path Method • The techniques help to answer questions like: • What is the expected project completion date? • What are the scheduled start/end dates for each activity? • Which activities are “critical”? • How long can a non-critical activity be delayed?
Critical Path Method • Initially, treat expected time (t) as fixed duration • The CP is the longest route through the network • If these activities are delayed, the whole project is delayed • To reduce the overall duration of the project look at the critical activities
CP calculation • Backward Pass For each activity calculate the Latest Start (LS) and Latest Finish (LF) LF for an activity entering a node = smallest value of LS for all activities leaving the node • Forward Pass For each activity calculate the Earliest Start (ES) and Earliest Finish (EF) ES for an activity leaving a node = largest value of EF for all activities entering the node
Slack • Slack is the length of time an activity can be delayed without affecting the completion date of the project.
Example Network Diagram C 2 5 3 F D 2 5 A 6 J G 7 8 3 E 4 1 2 3 B I 2 2 H 3 6 4
Adding ES, EF ES C [6,9] 3 2 5 EF F [9,11] 2 A [0,6] 6 D [6,11] 5 E [6,9] 3 G [11,14] 3 J [15,17] 2 7 8 4 1 I [13,15] 2 B [0,2] 2 H [9,13] 4 3 6
Adding LS, LF C [6,9] 3 [10,13] 2 5 F [9,11] 2 [13,15] A [0,6] 6 [0,6] LS D [6,11] 5 [7,12] LF E [6,9] 3 [6,9] J [15,17] 2 [15,17] G [11,14] 3 [12,15] 7 8 4 1 I [13,15] 2 [13,15] B [0,2] 2 [7,9] H [9,13] 4 [9,13] 3 6
Draw Network Diagram Budget approval from the CEO is required before purchasing a new machine for a factory. The use of new machine necessitates employing a new operator who must be specially trained, using a training manual and some special equipment, which is delivered with the machine. The training itself does not depend upon the new machine being installed and working. Once the machine is installed and the operator is trained, production can be started.
Formula for PERT a - Optimistic time, m - Most likely time, b - Pessimistic time Expected time: Variance of activities:
Let T be total time of project. Expected value of T is calculated as: • The variance in project completion time is:
Probability of meeting a specified deadline • Probability of completing the project in 20 weeks? • Need to use the z value, calculated as; By looking this z factor of 1.82 in the z table, we get the value of 0.9656, which means the chances of completing this project in 20 weeks are 96.56%.
Gantt Chart 1/1 1/15 2/1 2/15 3/1 3/15 4/1 4/15 5/1 5/15 Process Doc Contract Plan/Get data Perform tasks Write report Test/deliver Legend: Red = critical path; Blue = not critical path; Green = slack time Pakistan Institute of Management
Gantt Chart for Project X Pakistan Institute of Management
RESOURCE LEVELING Resource leveling aims to minimize the period-by-period variations in resource loading by shifting tasks within their slack allowances. Figure: Before resource leveling
Main Planning Activities; Defining and agreeing Scope statement Creating WBS (upto WP level) Defining activities and their predecessors Estimating resources (Time, People, Equipment, Materials etc., and associated Risks etc) Draw network diagram, determine CP and Float/Slack Make GANTT chart and do Resource Levelling Make a Detailed Project Management PLan
Key Earned Value (EV) Formulas Earned Value = Budgeted Cost of Work Performed (BCWP) Calculate BCWP by taking budgeted cost X % physical completion Cost Variance = CV=BCWP-ACWP (actual cost) Schedule Variance = SV=BCWP-BCWS (budgeted cost) Cost Performance Index = CPI=BCWP/ACWP Schedule Performance Index = SPI = BCWP/BCWS
Earned Value Calculations for a One-Year Project After Seven Months Activity Jan Feb Mar Apr May Jun Jul Aug Sep Oct Nov Dec Plan % Complete EV Planning and Staffing 3 2 5 100 5 Prototype Design 3 3 6 100 6 Construct Prototype 8 8 16 100 16 Test/Evaluate Prototype 5 10 15 80 12 Full Design Specs 5 6 3 14 50 7 Documentation 2 2 1 1 1 1 8 12 0.96 Site Preparation 8 3 3 14 36 5.04 Construction 20 50 50 20 140 15 21 Test/Certification 10 6 4 20 0 0 Finishing 8 4 12 0 0 Maintenance Training 4 4 0 0 Monthly Plan 3 5 11 13 15 16 28 54 61 27 13 8 254 73 BCWS or Cumulative Plan 3 8 19 32 47 63 91 145 206 233 246 254 Monthly Actual 4 4 10 11 12 15 27 0 0 0 0 0 83 ACWP or Cumulative Actual 4 8 18 29 41 56 83 Monthly EV 3 5 11 12 11 7 24 BCWP or Cumulative EV 3 8 19 31 42 49 73 BCWP = EV = 73 BCWS = 91 ACWP = 83 CV=BCWP-ACWP -10 SV=BCWP-BCWS -18 CPI=BCWP/ACWP 0.9 SPI=BCWP/BCWS 0.8 Estimated time to complete 15 (original plan of 12 months divided by SPI of 80%) Estimated cost at completion 289 (original plan of 254 divided by CPI of 90%)
Earned Value Chart for a Project EAC ETC Project budget base line COST BAC BCWS ACWP Cost variance Schedule variance Delay in completion BCWP TIME