Download
1 / 33
330 likes | 451 Vues
Organic Carbon in the Troposphere: Mysteries and Challenges. Colette L. Heald * * with acknowledgements to many people at the end. Michigan Tech October 19, 2009. CARBON IN THE ATMOSPHERE. Organic Carbon . +.

E N D
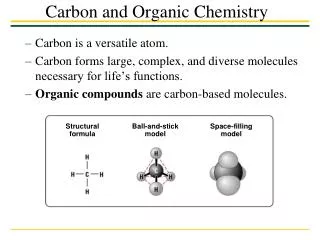
Organic Carbon in the Troposphere:Mysteries and Challenges Colette L. Heald* *with acknowledgements to many people at the end Michigan Tech October 19, 2009
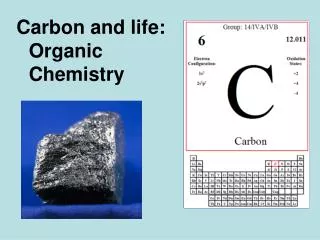
CARBON IN THE ATMOSPHERE Organic Carbon + Organic Carbon is a small part of the carbon pie: but it is the MOST reactive part (so LARGE fluxes) and the part that we know the LEAST about . Is it important to understand this better?
CONNECTION TO BIG RESEARCH TOPICS IN ATMOSPHERIC SCIENCE…A MOTIVATION TO GET IT RIGHT! AIR QUALITY / HEALTH CLIMATE VISIBILITY BIOSPHERE-ATMOSPHERE Clear Day
+ FEEDBACKS FROM CLIMATE CHANGE (moisture, precipitation, T, hv) ? ↓ OH = ↑ CH4 lifetime SECONDARY OA + oxidation O3 + oxidation PRIMARY OA EMISSIONS: Particles, Organics, NOx, … DISTURBANCE: Fires, beetles, land use change ECONOMICS, POPULATION, ENERGY USE ?
PARTS OF THE PUZZLE… • The budget: how much organic carbon is there in the atmosphere and in what phase? • An example of challenges in the gas-phase: ISOPRENE Emissions Chemistry • Challenges on the particle side: Missing primary biological sources How to simplify all that complex chemistry….? Is there any hope?
GAS-PHASE CARBON MASS CLOSURE? 2847 organic compounds identified in the atmosphere [Graedel et al., 1986] >105 compounds estimated to be present [Goldstein and Galbally, 2006] 30-100 compounds quantified in typical measurement campaigns Chebogue Pt, 1993 (NARE) UCLA, 1999-2000 [Chung et al., 2003] [Roberts et al., 1998] WINTER T/S ~ 1+ T/S ~ 1+ SUMMER T/S =1.4-2.2 ΣC2-C7 agree with total measured within measurement uncertainty Suggest that 20-45% NMOC unmeasured in photochemically aged airmasses
RECONCILING THE ORGANIC AEROSOL BUDGET SOA measured/modeled = 4-100! [Volkamer et al., 2006] Global measurements (surface 0.5-32 μgm-3) [Zhang et al., 2007]
PHASES OF ORGANIC CARBON GENERALLY CONSIDERED SEPARATELY OR ‘ONE-WAY’ Oxidation to CO/CO2 Oxidation & Condensation SOA POA Deposition Deposition
CONSIDER TOTAL ORGANIC CARBON (TOC) Oxidation to CO/CO2 TOC Oxidation & Condensation SEMI-VOLATILES Oxidation & Re-volatization CH4 Oxidation Deposition
FIELD SITES AND CAMPAIGNS Eleven datasets upwind/over/downwind of North America with simultaneous observations of gas phase and particle phase OC. (Over 130 organic compounds measured) TOC = Σgas-phase OC + aerosol-phase OC TOOC = Total Observed Organic Carbon [μgCm-3 @ STP] [Heald et al., ACP, 2008]
MEAN DAYTIME TOOC OVER NORTH AMERICA Increasing “age” Mean TOOC ranges from 4.0 μgCm-3 (Trinidad Head, cleanest) to 456 μgCm-3 (Mexico City, polluted) and generally decreases with age. Aerosol makes up 3-17% of TOOC.
PARTS OF THE PUZZLE… • The budget: how much organic carbon is there in the atmosphere and in what phase? • An example of challenges in the gas-phase: ISOPRENE Emissions Chemistry • Challenges on the particle side: Missing primary biological sources How to simplify all that complex chemistry….? Is there any hope?
ISOPRENE: CONTROLLING AIR QUALITY AND CLIMATE C5 H8: Reactive hydrocarbon emitted from plants (primarily broadleaf trees) Annual global emissions ~ equivalent to methane emissions CLIMATE Depletes OH = ↑ CH4 lifetime + OH O3 AIR QUALITY Beijing IPCC, 2007
METEOROLOGICAL AND PHENOLOGICAL VARIABLES CONTROLLING ISOPRENE EMISSION • LIGHT • Diffuse and direct radiation • Instantaneous and accumulated (24 hrs and 10 days) • TEMPERATURE (Leaf-level) • instantaneous and accumulated (24 hrs, 10 days) T L T PAR AMOUNT OF VEGETATION Leaf area index (LAI) • LEAF AGE • Max emission = mature • Zero emission = new LAI SUMMER Month SOIL MOISTURE suppressed under drought [Guenther et al., 2006]
ISOPRENE IN THE FUTURE NPP ↑ Temperature↑ 2000 2100 Methane lifetime increases [Shindell et al., 2007] SOA burden ↑ > 20% [Heald et al., 2008] Surface O3 ↑ 10-30 ppb [Sanderson et al., 2003] Isoprene emissions projected to increase substantially due to warmer climate and increasing vegetation density. LARGE impact on oxidant chemistry and climate
CO2 INHIBITION COMPENSATES FOR PREDICTED TEMPERATURE-DRIVEN INCREASE IN ISOPRENE EMISSION Empirical parameterization from plant studies [Wilkinson et al., 2009] MEGAN MEGAN with CO2 inhibition 696 Eisop (TgCyr-1) 523 508 479 2000 2100 (A1B) * With fixed vegetation CONCLUSION: Isoprene emission predicted to remain ~constant Important implications for oxidative environment of the troposphere… Global Model: NCAR CAM3-CLM3 (2x2.5)
UNLESS…CO2 FERTILIZATION IS STRONG • CLM DGVM projects a 3x increase in LAI associated with NPP and a northward expansion of vegetation. • [Alo and Wang, 2008] • Isoprene emissions more than double! (1242 TgCyr-1) • BUT, recent work suggests that NPP increases may be overestimated by 74% when neglecting the role of nutrient limitation • [Thornton et al., 2007] [Heald et al., GCB, 2009]
AND I HAVEN’T EVEN MENTIONED THESE… Boreal wildfires Deforestation in Rondonia Pine beetle kill in the Rocky Mountains Palm Plantations in Malaysia Pictures courtesy: Nick Hewitt, Christine Wiedinmyer
ONCE IN THE ATMOSPHERE, CHEMISTRY OF ISOPRENE NOT WELL UNDERSTOOD… Model simulation (GEOS-Chem) with “standard” chemistry AMAZE field campaign up to 29 ppb in Amazon Obs (NCAR) GEOS-Chem Leads to a factor 3-10 overestimate of observed isoprene! High isoprene concentrations titrates OH in low NOx regions (esp Amazon)
PARTS OF THE PUZZLE… • The budget: how much organic carbon is there in the atmosphere and in what phase? • An example of challenges in the gas-phase: ISOPRENE Emissions Chemistry • Challenges on the particle side: Missing primary biological sources How to simplify all that complex chemistry….? Is there any hope?
PRIMARY BIOLOGICAL AEROSOL PARTICLES (PBAP) ALGAE VIRUSES BACTERIA POLLEN FUNGUS PLANT DEBRIS Jaenicke [2005] suggests may be as large a source as dust/sea salt (1000s Tg/yr) Elbert et al. [2007] suggest emission of fungal spores ~ 50 Tg/yr
CURRENT SOURCE ESTIMATES FOR ORGANIC AEROSOL (Tg/yr) WITHOUT PBAP WITH PBAP? PBAP estimates ~1000 Tg/yr would swamp all other sources of organic aerosol. Fungal spores emissions equivalent to biomass burning? Budget #’s from GEOS-Chem [Park et al., 2003; Henze et al., 2008]
PBAP ACROSS THE SIZE RANGE? PM2.5 May also make important contribution to fine mode aerosol Dominates the coarse mode (pollens, debris…) From Andi Andreae (unpublished data)
USING OBSERVATIONS OF MANNITOL TO OPTIMIZE A SIMULATION OF FUNGAL SPORES I. Identify tracer to test simulation: Mannitol is a unique tracer for fungal spores [Bauer et al., 2008; Elbert et al., 2007] 1 pg mannitol = 38 pg OM* II. First-guess: constant emissions from Elbert et al. [2007], with 20% in fine mode III. Optimize emissions: Test meteorological drivers to reproduce observed variability Potential meteorological/phenological drivers [Jones and Harrison, 2004]: Temperature, radiation, wind speeds,surface wetness, precipitation, leaf area index (LAI), RH, water vapour concentrations and boundary layer depths BEST drivers are LAI and water vapour concentrations. CAUTION: not necessarily causal!
WHERE ARE FUNGAL SPORES AN IMPORTANT SOURCE OF ORGANIC AEROSOL? Generally contribute ~10% to fine mode surface OA, but > 30% in tropics
WHEN ARE FUNGAL SPORES AN IMPORTANT SOURCE OF ORGANIC AEROSOL? Hyytiala GEOS-Chem simulation unpublished data, Hanna Manninen Taiwan [Ho et al., 2005] Pronounced seasonality in extratropics (corresponding to vegetation cover), peaking in late-summer/fall as in measurements. Porto, Portugal [Sousa et al., 2008]
PBAP CONCLUSIONS COARSE OA SOURCE FINE OA SOURCES (Tg yr-1) (Tg yr-1) Fungal spores make a modest, but regionally important contribution to organic carbon aerosol budget. More observations needed to test… What about other PBAP types? [Heald and Spracklen, GRL, 2009]
PARTS OF THE PUZZLE… • The budget: how much organic carbon is there in the atmosphere and in what phase? • An example of challenges in the gas-phase: ISOPRENE Emissions Chemistry • Challenges on the particle side: Missing primary biological sources How to simplify all that complex chemistry….? Is there any hope?
HOW DOES AEROSOL COMPOSITION CHANGE? Organic aerosol consists of MULTITUDES of species, and can be produced in MANY ways. Once in the atmosphere, OA continues to evolve (oxidation = functionalization/fragmentation) Typically less than 20% of the mass of OA can be speciated [Williams et al., 2007] This looks HOPELESS! Can we learn anything from looking at the bulk composition? Van Krevelen diagram
AEROSOL “AGING” = CONSISTENT COMPOSITION CHANGES Surprisingly, despite complexity, aerosol composition changes during aging looks like carboxylation!
EXAMPLES FROM TWO FIELD CAMPAIGNS… Tight correlation on the “carboxylation line” for OA observed at Riverside, CA Aircraft observations around Mexico City coloured by photochemical clock shows how composition moves down the line with “aging” Hope for models? [Heald, Kroll et al., in prep]
CONCLUSIONS • SIGNIFICANT challenges in measuring and modeling organic carbon in the atmosphere • Fundamentally incomplete picture of the budget • Rapid developments to be anticipated! ↓ OH = ↑ CH4 lifetime SECONDARY OA + oxidation O3 + oxidation PRIMARY OA EMISSIONS: Particles, Organics, NOx, … DISTURBANCE: Fires, beetles, land use change ECONOMICS, POPULATION, ENERGY USE ?
ACKNOWLEDGEMENTS TOOC work: Measurement Teams for ICARTT, PAQS, MILAGRO, IMPEX, ITCT-2K2: James Allan, Allison Aiken, Eric Apel, Elliot Atlas, Angela Baker, Timothy Bates, Andreas Beyersdorf, Donald Blake, Teresa Campos, Hugh Coe, John Crounse, Pete DeCarlo, Joost de Gouw, Ed Dunlea, Frank Flocke, Alan Fried, Paul Goldan, Allan Goldstein, Rob Griffin, Scott Herndon, John S. Holloway, Rupert Holzinger, Jose Jimenez, Wolfgang Junkermann, William Kuster, Alastair C. Lewis, Simone Meinardi, Dylan Millet, Tim Onasch, Andrea Polidori, Patricia Quinn, Daniel D. Riemer James Roberts, Dara Salcedo, Barkley Sive, Aaron Swanson, Robert Talbot, Carsten Warneke, Rodney Weber, Petter Weibring, Paul Wennberg, Douglas Worsnop, Ann Wittig, Renyi Zhang, Jun Zheng, Wengang Zheng Isoprene & CO2 work: Mick Wilkinson, Russ Monson, Clement Alo, Guiling Wang, Alex Guenther Fungal spore work: Dominick Spracklen Aerosol Aging work: Jesse Kroll, Jose Jimenez, Ken Docherty, Pete DeCarlo, Allison Aiken