Download
1 / 5
50 likes | 208 Vues
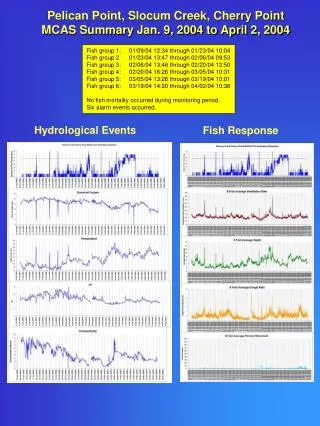
Pelican Point, Slocum Creek, Cherry Point MCAS Summary Jan. 9, 2004 to April 2, 2004. Fish group 1: 01/09/04 12:34 through 01/23/04 10:04 Fish group 2 01/23/04 13:47 through 02/06/04 09:53 Fish group 3: 02/06/04 13:48 through 02/20/04 12:50

E N D
Pelican Point, Slocum Creek, Cherry Point MCAS Summary Jan. 9, 2004 to April 2, 2004 Fish group 1: 01/09/04 12:34 through 01/23/04 10:04 Fish group 2 01/23/04 13:47 through 02/06/04 09:53 Fish group 3: 02/06/04 13:48 through 02/20/04 12:50 Fish group 4: 02/20/04 16:26 through 03/05/04 10:31 Fish group 5: 03/05/04 13:26 through 03/19/04 10:01 Fish group 6: 03/19/04 14:20 through 04/02/04 10:38 No fish mortality occurred during monitoring period. Six alarm events occurred. Hydrological Events Fish Response
Event 1 (1/18/04 21:04 - 21:19 and 1/18/04 to 21:49 - 23:19) Alarm event was caused by a significant increase in water temperature (from 12oC to 21oC) and decrease in dissolved oxygen (from 8.8 mg/L to 1.4 mg/L) over 4.5 hours, due to a main pump malfunction. This resulted in an increased fish ventilatory rate and ventilatory depth. Event 2 (1/27/04 1:17 through 1/27/04 03:02): Alarm event occurred due to a pump malfunction, similar to Event #1. Event 3(2/1/04 1:38 through 2/1/04 3:23): An alarm event similar to Events #1 and #2 occurred due to a pump malfunction. Event 4 (Multiple alarms from 2/18/04 17:50 through 2/20/04 13:05) There were 10 separate alarms over 9.5 hours. The only fish ventilatory parameter that changed was average depth. Conductivity during the acclimation / baseline period was ~5.00 mS/cm, whereas average conductivity during the alarm period was 0.98 mS /cm. There was an increase in average fish ventilatory depth in response to the decrease in conductivity (inversely proportional relationship).
Event 5 (2/27/04 9:56 through 2/27/04 10:11) An alarm event occurred for 15 minutes due to scheduled maintenance to the system. During that time there was a +2.5oC increase in temperature and -1.35 mg/L decrease in dissolved oxygen. All four ventilatory parameters increased, then recovered in the next period. Event 6 (Multiple alarms from 3/7/04 22:56 through 3/7/04 23:41) A 45-minute alarm event was caused by a sharp decrease in dissolved oxygen (by 1.02 mg/L) in 15 minutes, along with a gradual temperature increase. The alarm was primarily caused by increased fish ventilatory rate and ventilatory depth, consistent with the response patterns of events 1 through 3. Event 7 (Multiple alarms 3/9/04 9:26 through 3/19/04 09:31) Alarm events were caused primarily by decreased average fish ventilatory depth. The average depth during baseline was ~12 V, and the conductivity was ~2 mS/cm. At the time of the alarms, the average depth was ~5 V and the conductivity was ~5 mS /cm. The average depths of all fish were significantly lower than the average depths during the baseline period, resulting in a sustained “fish out of control” situation during the rest of the monitoring period for fish group 5.
Event 1 (1/18/04 21:04 - 21:19 and 1/18/04 to 21:49 - 23:19) An alarm event was caused by a significant increase in water temperature (from 12oC to 21oC) and decrease in dissolved oxygen (from 8.8 mg/L to 1.4 mg/L) in 4.5 hours, due to a main pump malfunction. This resulted in an increased fish ventilatory rate and ventilatory depth. Event 2 (1/27/04 1:17 through 1/27/04 03:02): Alarm event occurred due to a pump malfunction, similar to event #1. Event 3(2/1/04 1:38 through 2/1/04 3:23): An alarm event similar to events #1 and #2 occurred due to a pump malfunction. Event 4 (Multiple alarms from 2/18/04 17:50 through 2/20/04 13:05) There were 10 separate alarms during 9.5 hours. The only fish ventilatory parameter responding was average depth. Conductivity during the acclimation / baseline period was ~5.00 mS/cm, whereas average conductivity during the alarms was ~0.98 mS /cm. There was an increase in average fish ventilatory depth in response to the decrease in conductivity (inversely proportional relationship).
Event 5 (2/27/04 9:56 through 2/27/04 10:11) An alarm event occurred for 15 minutes, and during that time there was a +2.5 oC increase in temperature and -1.35 mg/L decrease in dissolved oxygen. All four fish ventilatory parameters increased during, then recovered in the next period. This alarm was caused by to scheduled maintenance to the system. Event 6 (Multiple alarms from 3/7/04 22:56 through 3/7/04 23:41) A 45-minute alarm event was caused by a sharp decrease in dissolved oxygen (by 1.02 mg/L) in 15 minutes, along with a gradual temperature increase. The alarm was primarily caused by increased fish ventilatory rate and ventilatory depth, consistent with the response patterns of events 1 through 3. Event 7 (Multiple alarms 3/9/04 9:26 through 3/19/04 09:31) Alarm events were caused primarily by decreased average fish ventilatory depth. The average depth during baseline was ~12 V, and conductivity was ~2 mS/cm. At the time of the alarms, the average depth was ~5 V and the conductivity was ~5 mS /cm. The average depths of all fish were significantly lower than the baseline period average depths, resulting in a sustained “fish out of control” situation during the rest of the monitoring period for fish group 5.