Download
1 / 12
130 likes | 363 Vues
Investigation of resonance phenomena in LC circuit. Theory. Photo. Table. Graph. Analysis. mA. Circuit LC - connection series. I. The impedance of this circuit is :. Z is minimum if. It is a resonance frequency in LC circuit connected in serial. Analysis. LC connected in serial.

E N D
Investigation of resonance phenomena in LC circuit
Theory Photo Table Graph Analysis
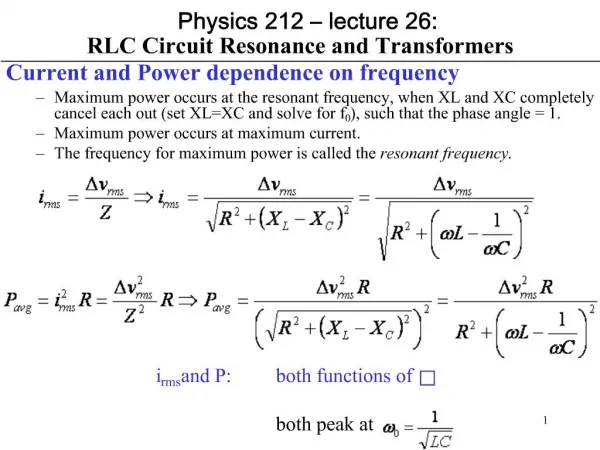
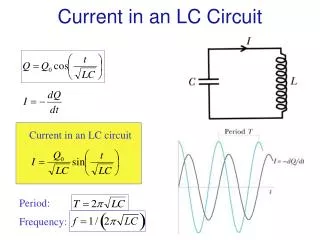
mA Circuit LC - connection series I
The impedance of this circuit is : Z is minimum if It is a resonance frequency in LC circuit connected in serial
Analysis. LC connected in serial. Theory shows that impedance of the circuit depends of the frequency and that this function has a minimum. The aim of this experiment was to investigate how an alternating current change follow the frequency. As you see, the minimum of this function exist and is between 380Hz and 390Hz. In this experiment inductivity and capacity were : L=36mH, C=4.7mF. Using formula: We receive:
Circuit LC - connection parallel mA mA mA
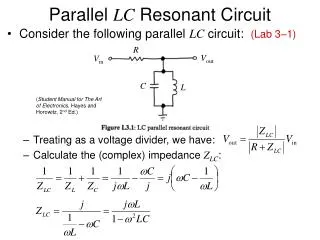
The impedance of this circuit is : Z has a maximum when I has a maximum when The resonance frequency of the parallel LC circuit
Analysis. LC connected in parallel. The impedance of the circuit is frequency dependent and this function has a maximum. The maximum occurs when I3 has a minimum at approximately between 380 to 390 Hz. In this experiment inductivity and capacity were : L=36mH, C=4.7mF. Using formula: We receive: