Human System Interface
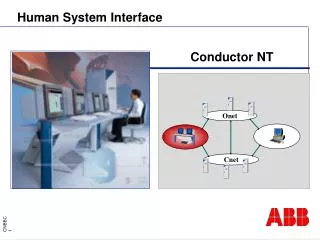
Human System Interface. Conductor NT. Onet. Cnet. Introduction. Overview The Conductor NT is an operating station for use with the Symphony, INFI 90 OPEN, DCI System Six, and Freelance 2000 Systems.

Human System Interface
E N D
Presentation Transcript
Human System Interface Conductor NT Onet Cnet
Introduction • Overview • The Conductor NT is an operating station for use with the Symphony, INFI 90 OPEN, DCI System Six, and Freelance 2000 Systems. • The Bailey systems are distributed process management and control systems. The Conductor NT, process control stations, and field wiring interface terminal boards form the basic building blocks of the distributed control system. • The Conductor NT is the human interface to this system, providing the process operator, process engineer, instrument engineer and maintenance personnel with global access to all process and system parameters required by each to perform their respective tasks.
Introduction • The Conductor NT operates on a personal computer hardware platform under the Windows 2000 environment. • Using interactive process graphics the process operator can monitor and control all analog loops and digital devices interfaced to the network via control stations. • The Conductor NT provides the engineer with an interface through which to configure and change graphic and hierarchical displays, database I/O, process control functions and sequences, log (report) formats, and security features (including access levels for operating personnel). Most changes are immediate, online and global, requiring no compilation time before downloading and, therefore, no interruption of the process.
Introduction • The Conductor NT provides maintenance personnel with the capability to globally monitor the operating status of any system component on the network, and to diagnose component failures from any Conductor NT.
Introduction • Functional Description • User Interface • The Conductor NT provides the process operator, engineer, and maintenance technician with a window-based interface to both the process and the Conductor NT itself. • Conductor NT Management Features • The Conductor NT contains many items which aid in managing use of the system. These include: • User log-ins. • Security features. • Messages. • Message routing. • System status display.
Introduction • Hierarchical Displays • Hierarchical displays are a set of preconfigured, group-wide, graphical representations emulating traditional instrument displays. A three-tiered hierarchy of displays exists to provide the user easy accessibility to process information. This hierarchy consists of summary, group, and point displays, which are available group wide. • A summary display provides an overview of 24 groups, arranged in six rows of four blocks. There are 1,000 summary displays available. • A group display provides an operation overview of four, six, or eight points simultaneously. All process control actions and alarm acknowledgment for points within a group can be performed from the group display on a point-by-point basis. • A point display provides the most detailed information and operation functions about a single point in the hierarchical display system. From this level the operator can perform regulatory changes.
Introduction • Graphic Displays • Up to 10,000 group wide graphic displays can be configured on the Conductor NT. • A graphic display configured on any Conductor NT is distributed (when saved or installed) to all Conductor NTs on the same network. The operator may control a process by using control pushbuttons located on graphic displays. • The display vector pushbutton allows the user to move quickly and easily to other graphics or displays of other types.
Introduction • Logging • Logs are used to collect and format data for use in reports and spreadsheet calculations. The two types of logs available on the Conductor NT include event logs and spreadsheet logs. • Trends • Trend traces display the values of one to eight points in an analog trend format similar to that presented by a conventional strip chart recorder. Three types of trend recording are provided on the Conductor NT, including current trending, historical trending and archival trending. Trend displays are available group wide.
Introduction • Process Alarms • A process alarm is generated when a process variable is in an abnormal condition. Process alarms are displayed in the top two lines of the mini-alarm window, in the alarm review display, and are accompanied by audible alarms. • Events • System events occur when a problem or change-of-state is detected with the control system, as opposed to abnormal conditions, problems, or changes-of-state associated with the process which is being monitored. System event messages are displayed in the third line of the mini-alarm window, the event review display, and the event historian.
Introduction • Message Review • Operator messages are used to provide the operator with information and instructions for performing actions, and can be generated from any Conductor NT. Operator messages are displayed in the fourth line of the mini-alarm window and in the message review display, and can be accompanied by an audible alarm. • Printer Review • Messages which have been sent to a printer or to a file can be displayed using the printer review display.
User Interface • The Conductor NT provides a window-based user interface to the process. Windows contain displays which can be accessed by the user via the input devices available on the system. The standard input devices are the keyboard and the mouse. • Three key types of windows which appear on the Conductor NT are the system, mini-alarm, and operator windows. One system window, one mini-alarm window, and up to four operator windows can appear on the display. Each of these window types has a different purpose and appearance.
User Interface • System Window • The system window is a small window located in the top left corner of screen, immediately to the left of the mini-alarm window • The system window cannot be moved, closed, or resized. • Components • Symphony logo pushbutton. • Date and time indicator. • Menu pushbutton and help icon.
User Interface • Mini-Alarm Window • The mini-alarm window is composed of the following: • Title bar. • Process alarm display area. • System event display area. • Operator message display area.
User Interface • Operator Window • The operator window provides the operator interface to the process, and can display output contained in process displays. • These process displays include: • Hierarchical displays (including summary, group and point displays). • Quick keys. • Trend displays. • Graphics. • System status display (SSD). • Process alarm review. • System event review. • Printer review. • Event historian. • Message review
User Interface • The operator window is composed of the three main window components: a title bar, a menu bar, and a display area. • The title bar identifies the number of the operator window and type of process display running in the window. • The menu bar provides the user with the following items: • • Window. • • Maximize/restore button. • • Select. • • Redraw. • • Zoom. • • Help.
User Interface • Operator Window Operations • A maximum of four operator windows can be opened on the Conductor NT. As windows are opened on the screen, the size and location of each window and its contents are automatically adjusted to fit in the available space. • Open • To open an operator window manually, from the system window, select: Menu > Windows > Open New Window.
Conductor NT Features • Getting Started • One of two states can exist on a Conductor NT that is running: • System default state. • User logged in state. • System Default State • The system default state occurs after a Conductor NT initial start up, after a user has logged out of a Conductor NT, or when a Conductor NT is restarted and auto-log-in is not possible.
Conductor NT Features • Logging In • The user logged-in state exists when a user (other than Default) has logged in. Users can be logged in manually or automatically. • To log in manually, select Menu > User. The menu displayed allows the user to log in to (or out of) the Conductor NT. • Select Log In from the menu; the window appears.
Conductor NT Features • Log-in Window
Conductor NT Features • Logging Out • When a user logs out of Conductor NT, the following actions take place on the computer from which the user is logging out: • The security access level, quick keys and CRT context keys change to those defined for the default user. • The user name in the title bar of the mini-alarm window changes to Default. • The log-in context changes to that of the default user, and the log-in parameters will change to those of the default user. • To log out, click Menu > User > Log Out. The current user will be logged out.
Conductor NT Features • Exiting Conductor NT • To exit the Conductor NT system, click Menu > User > Exit. • A window appears with two options, select the desired option and click OK. The user will be logged off and the selected exit option will be performed.
Conductor NT Features • Message Configuration • A method of communication between operators is available on the Conductor NT, allowing text messages known as operator messages to be sent from one plant area to another. • The message configuration feature provides this method of generating operator messages from a Conductor NT. • To create an operator message, select Menu > Configure > Message Configuration.
Conductor NT Features • System Status Display • The system status display (SSD), provides information about each node connected to the distributed control system. A node can be a Conductor NT or a server.
System Status Display • Conductor NT Nodes • All SSD objects, regardless of node type, share certain features, including: • Node name. • Info menu. • Node Name • The node name is displayed on the face of the button which is located below the node icon. The node name is composed of a three character descriptor which indicates the device type (i.e., server, or Conductor NT) followed by the device number (i.e., Con6). The color of the node name indicates the network status of the node.
System Status Display • Cyan Indicates that the node is the local Conductor NT node. • NOTE: The local node is also indicated by an asterisk (*) following the node name. • White Indicates the node is on the network. The node can be accessed by the local Conductor NT. • Black (text and node icon) on Red (button color) Indicates that the node is not currently on the network. The node can no longer be accessed from the local Conductor NT.
System Status Display • Info Menu • Click the button containing the node name to display the menu for a node. The menu for each node contains a button labeled Info. Click this button to access the info menu which contains, at the minimum, the following two entries: • Network Info. • Show Available Service.
System Status Display • Process Station and Server Nodes • The process station and server node provides access to the distributed control system elements. Click the button containing the node name to display a menu for the node. Menu items depend on the node type.
System Status Display • Device Status • The Utilities, located on the system status display menu bar, provides access to printer device status information and printer control utilities. • Click Utilities > Device Status, to access the printer control utilities and display the window
Hierarchical Process Displays • Summary Display • A summary display provides an overview of 24 groupings of points, arranged in six rows of four blocks, each representing a group (Fig. 4-3). • There are 1,000 summary displays available.
Hierarchical Process Displays • Group Status Conditions
Hierarchical Process Displays • Group Information Window
Hierarchical Process Displays • The group window provides an overview of a group of points, listing both the point name and the status of each point. • From this window, it is possible to go directly to any one of the following displays: • Group display for the group. • Point display for any tag in the group. • Graphic display assigned to the group. • Trend display assigned to the group. • Next or previous group display.
Hierarchical Process Displays • Alarms cannot be acknowledged from the summary display, nor can they be acknowledged from the group window. The window ack key has no effect when the window with focus contains a summary display. Alarms can be acknowledged from group, point, graphic and alarm review displays, or from the mini-alarm window.
Hierarchical Process Displays • Group Display • A group display presents operational data for up to eight tags simultaneously . Points are assigned to the group display according to their location in the group info window. Any tag in the distributed control system server database can be assigned to a group display. • Control faceplates are assigned to the group display according to their location in the Group Info window. • All available process control actions (i.e., auto, manual, run, reset, and so on) and alarm acknowledgment for tags in a group can be performed from the group display on a point by point basis.
Hierarchical Process Displays • Group Display Configured for Four Tags
Hierarchical Process Displays • Point Display • The point display provides detailed information for a tag in the global database, including information not shown on the group display. In addition, the parameters of a tag may be changed from the point display.
Hierarchical Process Displays • Accessing the Point Display • A point display can be accessed by one of several methods: • 1. From a group display, click the tag name pushbutton of the desired tag . • 2. From the group info window of a summary display click the tag name pushbutton of the desired tag. • 3. From the alarm review display, click the pushbutton labeled V on the line containing the desired tag. • 4. From the operator window click Select > Point. The enter tag name window will appear. • 5. From the keyboard, press F4. The enter tag name window will appear. Enter the tag name as described in item four above.
Hierarchical Process Displays • Analog Module Point Display
Faceplates • Info Pushbutton • The info pushbutton appears at the top right corner of the point display. Click this pushbutton to view the operating parameters window
Faceplates • BLKTune Pushbutton • BLKTune appears at the top right corner of the point display. Click this pushbutton to view the block details window
Block Details • Introduction • The block details function allows the user to inspect function blocks that are contained within a selected processor module. • It displays the specifications and the outputs of a selected function block and additional information related to the function code. • The user can also tune the specifications of the selected function block. • It also provides various ways of jumping to other function blocks in the module.
Block Details • Specifications Tab • The Specifications tab displays a list of function code specification records which consists of these columns: • Spec - the specification number. • Value - the current value of the specification. • Description - the meaning of the specification. • Icons in the Spec column show additional information about each specification. The menus are different for each specification, but all of them have a Properties option.
Block Details • Tunable Blocks • Specifications whose value may be changed while the module is in execute mode are said to be tunable. The tuning function of the specification is initiated by selecting a tunable specification with a right-click. A menu appears, and by selecting Tune from the menu a Tuning window appears. This window can also be displayed by double-clicking on a tunable specification.
Block Details • Output Tab • The Output tab displays function block output records. The following items are shown: • Output - Output number. • Block - Block number that is associated with the output number. • Type - Data type of the output value. • Value - Value of the block output. • Description - Description of the meaning of the output value. • The lower portion of the page provides additional notes on the outputs.
Block Details • Output Tab
Block Details • Description Tab • The Description tab contains a description of the function code that is currently on display. The lower portion of the page provides additional notes on the function code.
Operating Parameters • The operating parameters application is opened in a point display by clicking on Info. This will launch the operating parameters application for that tag and allows application for server diagnostics. • The operating parameters application allows the user to monitor and change the status of tags maintained by the server. The tag attributes are presented in a series of tabbed pages.
Operating Parameters • Operating Parameters Window