Download
1 / 79
790 likes | 921 Vues
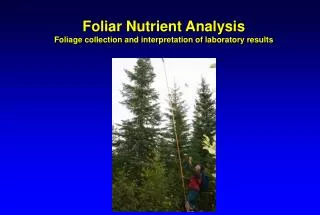
This document outlines innovative methods for evaluating foliar nutrient status which are crucial for effective fertilization strategies in forestry. It emphasizes the significance of foliar analysis as a planning tool to confirm nitrogen deficiencies, identify secondary nutrient deficiencies (like sulfur and boron), and formulate appropriate fertilizer prescriptions. The guide also details foliar sampling protocols, including optimal timing and methods for collecting foliage. Additionally, it addresses factors affecting the interpretation of nutrient data, ensuring accurate decision-making based on reliable diagnostic information.

E N D
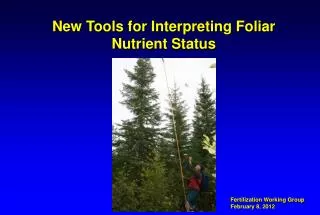
New Tools for Interpreting Foliar Nutrient Status Fertilization Working Group February 8, 2012
Operational fertilization decision-making • Forest level considerations • Stand level considerations • operational factors • biological factors • species • stand structure • crown conditions • insect/disease • nutrient status
Foliar analysis as a planning tool • Foliar analysis can be used to: • confirm N deficiency
Foliar analysis as a planning tool • Foliar analysis can be used to: • confirm N deficiency • identify secondary nutrient deficiencies (e.g., S, B)
Foliar analysis as a planning tool • Foliar analysis can be used to: • confirm N deficiency • identify secondary nutrient deficiencies (e.g., S, B) • make appropriate fertilizer prescriptions
Foliar analysis as a planning tool • Foliar analysis can be used to: • confirm N deficiency • identify secondary nutrient deficiencies (e.g., S, B) • make appropriate fertilizer prescriptions • assess post-fertilization nutrient uptake and foliar nutrient balance
Foliar Sampling Protocol • Sample during the dormant season
Seasonal change in foliar %N in Douglas-fir foliage Moderate deficiency May Dec June July Aug Sept Oct Nov Month
Seasonal change in foliar %N in Douglas-fir foliage Moderate deficiency May Dec June July Aug Sept Oct Nov Month
Foliar Sampling Protocol • Sample during the dormant season • Sample current year’s foliage
Foliar Sampling Protocol • Sample during the dormant season • Sample current year’s foliage • Collect foliage from between top 1/4 and bottom 1/2 of live crown
Foliar Sampling Protocol • Sample during the dormant season • Sample current year’s foliage • Collect foliage from between top 1/4 and bottom 1/2 of live crown • Collect foliage from healthy, representative trees
Foliar Sampling Protocol • Sample during the dormant season • Sample current year’s foliage • Collect foliage from between top 1/4 and bottom 1/2 of live crown • Collect foliage from representative trees • Collect foliage from at least 20 trees per stand or stratum
Foliar sampling layout Road x x x x x x x x Line 2 x x Line 1 x x x x x x /01 x x x x /02
Foliar Sampling Protocol • Sample during the dormant season • Sample current year’s foliage • Collect foliage from between top 1/4 and bottom 1/2 of live crown • Collect foliage from representative trees • Collect foliage from at least 20 trees per stand or stratum • For routine diagnoses, combine equal amounts of foliage from individual trees into one composite sample per stratum
Foliar Sampling Protocol • Sample during the dormant season • Sample current year’s foliage • Collect foliage from between top 1/4 and bottom 1/2 of live crown • Collect foliage from representative trees • Collect foliage from at least 20 trees per stand or stratum • For routine diagnoses, combine equal amounts of foliage from individual trees into one composite sample per stratum • Keep samples cool until foliage is dried
Factors affecting interpretation of foliar nutrient data • Foliar sampling protocol
Factors affecting interpretation of foliar nutrient data • Foliar sampling protocol • Site ecological characteristics
Factors affecting interpretation of foliar nutrient data • Foliar sampling protocol • Site ecological characteristics • Laboratory analytical methodology
Relationship between foliar N analytical methodologiesdry combustion vs. wet digestion
Relationship between foliar S analytical methodologies dry combustion vs. wet digestion
Accounting for differences in laboratory analytical methodology • Differences may be large enough to affect interpretation
Accounting for differences in laboratory analytical methodology • Differences may be large enough to affect interpretation • Nutrient interpretative criteria do not account for differences in methodology
Accounting for differences in laboratory analytical methodology • Differences may be large enough to affect interpretation • Nutrient interpretative criteria do not account for differences in methodology • Known differences in laboratory analytical results can be used to “normalize” foliar data prior to interpretation
Accounting for differences in laboratory analytical methodology • Differences may be large enough to affect interpretation • Nutrient interpretative criteria do not account for differences in methodology • Known differences in laboratory analytical results can be used to “normalize” foliar data prior to interpretation • “Normalization” requires inter-laboratory comparisons
Accounting for differences in laboratory analytical methodology • Differences may be large enough to affect interpretation • Nutrient interpretative criteria do not account for differences in methodology • Known differences in laboratory analytical results can be used to “normalize” foliar data prior to interpretation • “Normalization” requires inter-laboratory comparisons • The “normalization” process does not make inferences about the quality of foliar nutrient data
Inter-laboratory comparisonPacific Soil Analysis vs. Ministry of Environment
Inter-laboratory comparisonPacific Soil Analysis vs. Ministry of Environment • 48 previously collected Pl foliage samples were selected
Inter-laboratory comparisonPacific Soil Analysis vs. Ministry of Environment • 48 previously analyzed Pl foliage samples were used • Samples were selected to cover a broad range of foliar nutrient levels
Inter-laboratory comparisonPacific Soil Analysis vs. Ministry of Environment • 48 previously analyzed Pl foliage samples were used • Samples were selected to cover a broad range of foliar nutrient levels • Each sample was thoroughly mixed and split into two sub-samples
Inter-laboratory comparisonPacific Soil Analysis vs. Ministry of Environment • 48 previously analyzed Pl foliage samples were used • Samples were selected to cover a broad range of foliar nutrient levels • Each sample was thoroughly mixed and split into two sub-samples • One sub-sample was shipped to each lab in December 2011
Inter-laboratory comparisonPacific Soil Analysis vs. Ministry of Environment • 48 previously analyzed Pl foliage samples were used • Samples were selected to cover a broad range of foliar nutrient levels • Each sample was thoroughly mixed and split into two sub-samples • One sub-sample was shipped to each lab in December 2011 • For each nutrient, laboratory results were reviewed and subjected to regression analysis
Inter-laboratory comparisonPacific Soil Analysis vs. Ministry of Environment • 48 previously analyzed Pl foliage samples were used • Samples were selected to cover a broad range of foliar nutrient levels • Each sample was thoroughly mixed and split into two sub-samples • One sub-sample was shipped to each lab in December 2011 • For each nutrient, laboratory results were reviewed and subjected to regression analysis • Based on previous research, equations were selected to “normalize” foliar nutrient data
Inter-laboratory comparisonPacific Soil Analysis vs. Ministry of Environment • 48 previously analyzed Pl foliage samples were used • Samples were selected to cover a broad range of foliar nutrient levels • Each sample was thoroughly mixed and split into two sub-samples • One sub-sample was shipped to each lab in December 2011 • For each nutrient, laboratory results were reviewed and subjected to regression analysis • Based on previous research, equations were selected to “normalize” foliar nutrient data • An Excel spreadsheet was developed to facilitate “normalization” for practitioners