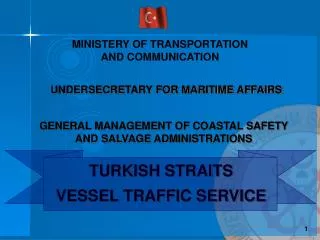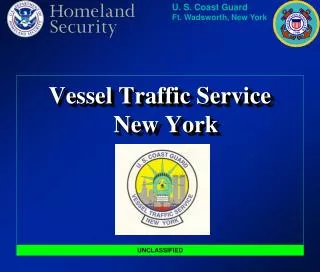
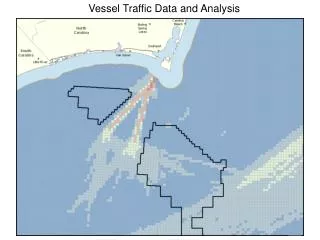
Vessel Traffic Data and Analysis
Vessel Traffic Data and Analysis. What is AIS?. Automated Identification System (AIS) Vessel Identification and Tracking System – Based on GPS and VHF Broadcasting Required on all Vessels over 300 GT (1) Provides Situational Awareness in Real Time (collision avoidance etc.)

Vessel Traffic Data and Analysis
E N D
Presentation Transcript
What is AIS? • Automated Identification System (AIS) • Vessel Identification and Tracking System – Based on GPS and VHF Broadcasting • Required on all Vessels over 300 GT • (1) Provides Situational Awareness in Real Time (collision avoidance etc.) • (2) Collected data produces a historical archive of Vessel Traffic for the Entire Coast.
AIS Analysis Input Data • AIS Returns for 2009 • Monthly Data for Atlantic – Maine to Florida • Each Month is Clipped by Protraction, then Merged • AIS Analysis Input Includes all Months for 2009 • June is missing 25 days of data for 2009
AIS Density Mapping • Quantify unique vessels (MMSI) passing through each leasing unit (aliquot) per year. • Extract deep draft vessel types for depicting traffic volume for larger vessels. • Other mapping includes avg. vessel time in aliquot, avg. speed, etc.
OCS Blocks – 2.6nm x 2.6nm, Aliquots (sub-blocks) - .65nm x .65nm
Extracting Vessels by Deep Draft Type • Cargo Vessels, Tankers, Tugs, Towing, Towing > 200m • Comparison of unique traffic patterns by type. • Maps use a more sensitive color scale to display lower volume types.