Download

1 / 6
60 likes | 178 Vues
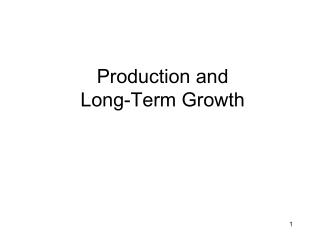
Projected Long Term Growth in Net Farm Income. Average Annual Net Farm Income 1980 - 2020. ($ in billions). $100. $83.6B. $80. $61.1B. $60. $48.1B. $40. $29.1B. $20. ' 80 - ' 89. ' 90 - ' 99. ' 00 - ' 09. ' 10 - ' 20. Long Term Growth Drivers

E N D
Projected Long Term Growth in Net Farm Income Average Annual Net Farm Income 1980 - 2020 ($ in billions) $100 $83.6B $80 $61.1B $60 $48.1B $40 $29.1B $20 ' 80 - ' 89 ' 90 - ' 99 ' 00 - ' 09 ' 10 - ' 20 • Long Term Growth Drivers • Income Growth in Developing Countries • Increasing Demand for Biofuels • Technological Advances – Genetics, Crop Production, GPS Source: USDA, expressed in nominal dollars
Increasing Demand from Developing Countries Household Disposable Income Over U.S. $10,000 Source: Euro monitor, Morgan Stanley Research • Increasing Household Incomes in Developing Markets Drive Demand for Protein and Grains • 4 of the Top 5 US Soybean Acreage Counties are in ND • Cass County #1 / Richland County #2
Increasing Demand for Biofuels 2011 Ethanol Production Capacity in ND Source: Nebraska Energy Office (NEO) • Ethanol Production Drives Demand for Corn Production • US Ethanol Production to Grow From 13.5B Gal to 15B Gal by 2015
Technological Advances ND Corn Production 1995-2010 Source: USDA, NASS Technological Advances Allow Increased Acres and Yield • Ave Corn Yield Increased from 79 bu per acre in 1995 to 132 bu per acre in 2010 due to Technological Advances in Seed Genetics and Production Methods
Ag Economic Impact in ND Since 2000 AG Revenue & Inputs have Increased Over 200% Source: USDA, NASS AG Inputs • Fuel Provider • Fertilizer Supplier • Seed Dealer • Chemical Vendor • Vehicle & Equipment Dealer • Employees