Download
1 / 23
230 likes | 356 Vues
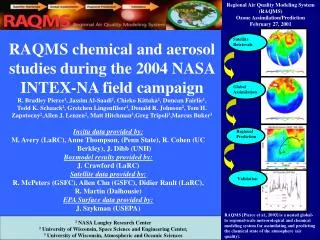
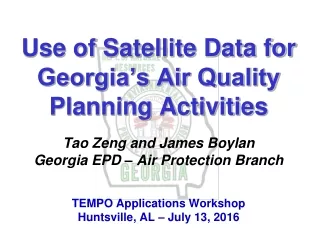
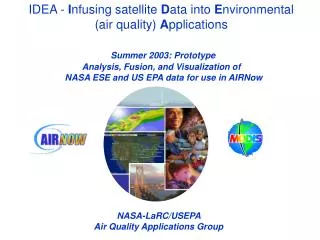
IDEA - I nfusing satellite D ata into E nvironmental (air quality) A pplications Summer 2003: Prototype Analysis, Fusion, and Visualization of NASA ESE and US EPA data for use in AIRNow. NASA-LaRC/USEPA Air Quality Applications Group.

E N D
IDEA - Infusing satellite Data into Environmental (air quality) Applications Summer 2003: Prototype Analysis, Fusion, and Visualization of NASA ESE and US EPA data for use in AIRNow NASA-LaRC/USEPA Air Quality Applications Group
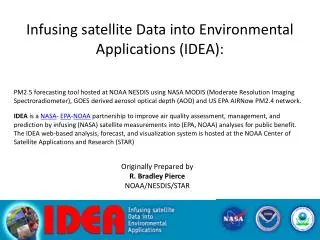
IDEA: NASA-EPA-NOAA partnership to improve air quality assessment, management, and prediction by infusing (NASA) satellite measurements into (EPA, NOAA) analyses for public benefit. IDEA (Infusing satellite data into environmental air quality applications) Part of NASA Earth Science Enterprise (ESE) Applications Program strategy to demonstrate practical uses of NASA sponsored observations from remote sensing systems and predictions from scientific research.
AIRNow • AIRNow is a website to provide the public with easy access to national air quality information. The website offers daily air quality forecasts as well as real-time air quality for over 275 cities across the U.S., and provides links to more detailed State and local air quality websites. • It is a joint partnership between EPA, State and local air quality agencies. The mission of the AIRNow program is to provide air quality forecasts and real-time air quality information in a visual, easy-to-understand format.
AIRNow Website • 14 States • 5 Domains • Maps updated 7 times/day • Data Collection Center (DCC) at MCNC • Animation, 1-hr & 8-hr Peak Maps • Forecasts for 35 Cities • August 17, 1998 • Midwest States added • 20 States • 12 Domains AIRNow Online - May 14, 1998 Ozone
33 States • 37 Domains • 7 updates/day • EPA & West Coast DCC’s • merge • 125 Forecast Cities • … and National Outreach AIRNow May 1, 2000Ozone
AIRNow 2001 - Extended into CanadaOzone Canada 1-hr AQI - English Canada 1-hr AQI - French U.S. 8-hr AQI
- AQI Forecast for 36 Cities h • AQI Forecasts for • 125 Cities • Maps and Forecasts • delivered to major WSP’s AIRNow 2000 - Media OutreachOzone
AIRNow 2003AQI (PM 2.5) Reporting & Mapping • Real-Time Reporting & Mapping of PM2.5 • Air quality (esp. PM2.5) is a year-round problem & scientific evidence pointing to PM2.5 as a serious health concern • Over 230 continuous PM2.5 monitors reporting data to AIRNow DMC • Various mapping approaches being developed, analyzed and implemented • Target: Maps for the public by October 1, 2003
AIRNow 2003AQI (PM 2.5) Forecasting • AQI Forecasting for PM2.5 • Provides year-round coverage • EPA pilot effort focusing on 36 major cities across the U.S. • Currently developing PM2.5 forecast tools for State and Local Agencies – MODIS/AIRNow data fusion would be one of many tools • Target: PM2.5 forecasts for the public for all 36 cities by October 1, 2003
NASA MODIS - EPA AIRNow Data Fusion Demonstration 2003:Improving Air Quality Index (PM 2.5) Forecasting What:Near-Real-Time Data Fusion of MODIS Direct Broadcast and EPA AIRNow Data (Currently using NOAA Bent Pipe) When:Summer 2003 Who:NASA LaRC and GSFC CIMSS/SSEC Univ. Of Wisc.-Madison & NOAA US EPA OAR/OAQPS Select group of AQI Forecasters Objective:Prototype a NRT product for AQI Forecasters Goal: Improve accuracy of next day PM2.5 AQI forecast during large aerosol events
Application of MODIS Data within US EPA AIRNow Program AIRNow Air Quality Index (AQI) PM2.5 forecasting Data User - AQI Forecasters: • State & local air management agencies, as well as commercial interest (access to a combined MODIS/TEOM data product will increase forecast skill in next-day regional AQI forecast) Benefit - AQI Forecasts Users: • Government and Industry who want take action to reduce source emissions for forecast days with poor air quality • Commercial media outlets that provide AQI forecast information • Sensitive populations adversely affected by poor air quality
Prototype - US EPA AIRNow Use of MODIS Data NOAA bent pipe Direct Broadcast* AQUA-1 MODIS TERRA MODIS ~1:30 local overpass ~10:30 local overpass NOAA NESDIS/ORA Products NASA GFSC DACC Aerosol Optical Depth (MOD04_L2) Cloud Optical Thickness (MOD06_L2) NASA GFSC Science Team Products (Near Real Time) SSEC/CIMSS Univ. of Wisc.Madison (MIPPS) DB Aerosol Optical Depth (MOD04_L2) DB Cloud Optical Thickness (MOD06_L2) Products Algorithms US EPA AIRNow DMC NOAA OAR/ARL NASA LaRC *Note: SSEC/CIMSS indicated that DB will not be implemented until the end of the summer. Current plan is to use NOAA bent pipe to generated NRT for prototype, until DB begins. Products AIRNow Hourly PM2.5 Data Products Products State & Local MODIS/AIRNow Data Fusion Site Static Data EDAS Forecast Data Canadian Providences AIRNow Forecasters < Back
MODIS (Terra) Overpass Time < Back
MODIS (Terra) AOD & COT < Back
MODIS (Terra) AOD & COT < Back
MODIS (Terra) AOD & COT < Back
MODIS (Terra) AOD & COT < Back
Still Imagery with Text Explanation 0.0 0.2 0.4 0.6 0.8 1.0 0 10 20 30 40 50 60 70 0 15.5 40.5 65.5 150.5 Aerosol Optical Depth Cloud Optical Thickness PM2.5 (ug/m3) 10 Sept. 2002- A different projection from VGEO shows the results of the forward air parcel trajectories after 53 hrs initialized at 850mb from NOAA/ARL HYSLPIT model. A cluster of the trajectories appear close to the ground surface in areas of high AOD from MODIS. NASA-LaRC/USEPA Air Quality Applications Group


![d ata[0]](https://cdn1.slideserve.com/3300577/slide1-dt.jpg)