Download
1 / 1
10 likes | 115 Vues
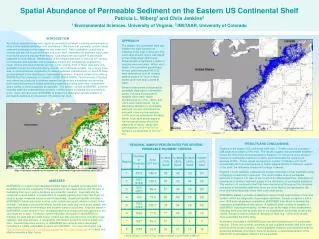
Spatial Abundance of Permeable Sediment on the Eastern US Continental Shelf Patricia L. Wiberg 1 and Chris Jenkins 2 1 Environmental Sciences, University of Virginia; 2 INSTAAR, University of Colorado. INTRODUCTION

E N D
Spatial Abundance of Permeable Sediment on the Eastern US Continental Shelf Patricia L. Wiberg1 and Chris Jenkins2 1 Environmental Sciences, University of Virginia; 2 INSTAAR, University of Colorado INTRODUCTION An obvious question to ask with regard to permeable sediment in marine environments is what is their spatial distribution and abundance? We know that, generally, modern sandy sediment dominates in the nearshore and inner shelf. Relict sediment of sand size or coarser can also be found on the mid and outer shelf, depending on sediment input rates from fluvial sources and sea-level history. Quantifying the abundance of permeable sediment is more difficult. Observations of the seabed date back to the mid 19th century in connection with scientific and engineering studies and navigational, engineering, naval, mining and environmental surveys. Until recently, most of these data were only available through journal publications, reports, and individual contacts. As a result, there was no comprehensive compilation of seabed sediment characteristics on which to base an assessment of the abundance of permeable sediment. A recent collaboration among INSTAAR at the University of Colorado, USGS, NOAA-NGDC, The University of Sydney and others has produced a software system that generates a database incorporating both numerical and word-based sediment properties including grain size, composition, and a variety of other properties as available. The system, named dbSEABED, currently includes sediment characteristics at nearly 1 million points worldwide and continues to grow. Here, we have used dbSEABED to assess the distribution and abundance of permeable sediment on the eastern US continental shelf. APPROACH The eastern US continental shelf was divided into eight subunits as indicated in the map on the right. The outer edge of each region was based on the morphologic shelf break. Estuaries with a significant number of samples were exlcuded. Within each region, the cumulative percentages of mud, sand and gravel (M,S,G) were determined from all numeric seabed surface (0-10cm in most cases) grain size data (curves at right). Several criteria were considered as potentially diagnostic of permeable sands, including the percent of samples within each region characterized by >70%, >80%, and >90% sand (table below). As an alternative definition of permeable sediment, we also considered the area with a low mud percentage, (<10% mud) as indicated in the table below. High sand percentages or low mud percentages should be diagnostic of “clean” sands with permeabilities of 10-9-10-12 m2 or hydraulic conductivities of 10-2-10-5 m/s. RESULTS AND CONCLUSIONS Regions of the eastern US continental shelf with > 70-80% sand are consistent with areas that contain <10% mud. The results suggest that permeable sediment covers 50-70% of the continental shelf in Regions 1-6. Using the more stringent criterion for permeable sediment of >90% sand decreases the value by an average of 25%. These values are based on number of samples and could overestimate the true area because of higher sample density in shallower regions of the shelf; the difference should not be large, however. Regions 1-6 are relatively unaffected by modern discharge of river sediment owing to trapping of sediment in estuaries. The much smaller area of permeable sediment in Regions 7-8, west of the mouth of the Mississippi River, illustrates the importance of modern sediment supply in the distribution of permeable sediment. The western US continental shelf has been depositional throughout the Holocene and areas of permeable sediments there are more likely to be restricted to the inner shelf/shoreface with some relict outer shelf sands. dbSEABED makes it possible to determine areas of high sand content or low mud content, which are diagnostic of permeable sediment. Except in regions 3 and 4, over 1000 data values were available in dbSEABED from which to develop the cumulative probabilities shown above. A relatively small number of samples in dbSEABED include permeability, too few to use as the basis of this assessment. Including sorting as well as grain size in our assessment would help to refine the results, though a criterion based on absence of mud (e.g., <10% mud values) does essentially the same thing. At present, most data in dbSEABED are from the Australian and US continental margins. Efforts are currently underway to add available seabed data from other portions of the world’s margins. As the database expands and interactive tools for accessing database information become available, a global assessment of the distribution of permeable sediment will be possible. REGIONAL SAMPLE PERCENTAGES FOR SEVERAL PERMEABLE SEDIMENT CRITERIA Map of dominant material for the eastern US continental margin generated by dbSEABED. dbSEABED dbSEABED is a system that integrates multiple types of seabed point data from any available source into a mapping of the properties of the ocean bottom with the goal of facilitating their use in policy decisions and scientific research. Input data can be numerical or word based. A combination of linguistic parsing and Fuzzy Set Theory is used to assign numerical values to word-based data. Seabed properties included in dbSEABED include grain size, sorting, color, carbonate/organic carbon content, shear strength, void space and sound velocity, bottom type code (e.g. mud, sand, gravel) and classification based on mineralogy and biogenic parts or structures. Data are stored in dbSEABED in their primitive form, facilitating importing of data and management of the very large set of data. A software system has been developed in dbSEABED to manage the data and generate output. Output can take several forms, including maps, statistics, and data subsets. A Geographic Information System is used to display the data. Several interactive versions of dbSEABED are currently being developed including the USGS usSEABED program and iSEABED. For more information see http://instaar.colorado.edu/~jenkinsc/dbseabed or http://kai.er.usgs.gov Coastal and Marine Interactive Map Server. † Sand samples; number of mud samples indicated in parentheses if different