Download
1 / 61
620 likes | 798 Vues
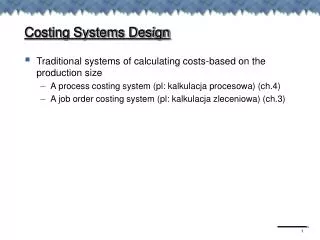
Costing Systems. Chapter 4. Product Costing. To compute the cost of products, it is necessary to decide on (1) the

E N D
Costing Systems Chapter 4 © 2007 by Nelson, a division of Thomson Canada Limited.
Product Costing To compute the cost of products, it is necessary to decide on (1) the product costing system and (2) the valuation method to be used. The costing system defines the cost object and the method of assigning costs to production. The valuation method specifies how the costs will be measured. Companies must have both a cost system and a valuation method. These activities are necessary for strategic success. This chapter will introduce the two primary cost systems – job order and process. Three valuation methods can be used – actual, normal and standard. This chapter discusses the first two valuation methods. The third, standard costing, will be discussed in a later chapter. © 2007 by Nelson, a division of Thomson Canada Limited.
Learning Objectives What production situations are appropriate for a job order costing system and why? What production situations are appropriate for a process costing system and why? How is a cost of production report prepared under the weighted average method of process costing? What is the effect of multidepartmental processing on the computation of equivalent units of production? How are equivalent units of production, unit costs, and inventory values computed using the FIFO method of process costing? (Appendix 4A) © 2007 by Nelson, a division of Thomson Canada Limited.
Learning Objectives How is a cost of production report prepared under the FIFO method of process costing? (Appendix 4A) How do normal and abnormal losses of units differ and how is each treated in the calculations of an equivalent units of production schedule? (Appendix 4B) © 2007 by Nelson, a division of Thomson Canada Limited.
Job Order Costing System Job order costing – a product costing method used by entities that produce limited quantities of custom-made goods or services that conform to specifications designated by the purchaser. Each job in a job cost system is treated as a unique cost entity or cost object. Job order costing is useful in companies like Dell Computer Corporation which concentrates on direct selling to customers. The company configures computers to meet each customer's needs. The use of job order costing allows the costs and profits of each job to be knowns. © 2007 by Nelson, a division of Thomson Canada Limited.
Job Order Costing System Job – a single unit or group of like units identifiable as being produced to distinct customer specifications Since job results are heterogeneous and distinctive in nature, the costs of those jobs are, logically, not averageable. Each job has a Work-In-Process subsidiary ledger account. The balance in the Work-In-Process control account is the sum of the balances of the accounts in the Work-In-Process subsidiary ledger. © 2007 by Nelson, a division of Thomson Canada Limited.
Control and Subsidiary Ledger Accounts General LedgerSubsidiary Ledger Work-In-Process Control Job #1 Direct materials XXX Transferred to Direct materials XX Direct labour XX Finished Goods Direct labour XX Overhead XXXX or next department Overhead XX Balance 5,000 Balance 1,500 Direct materials XX Direct labour X Overhead XX Balance 1,000 Direct materials X Direct labour X Overhead XXX Balance 2,500 Job #2 Job #1 $1,500 Job #2 1,000 Job #3 2,500 Control $5,000 Job #3 © 2007 by Nelson, a division of Thomson Canada Limited.
Job Order Costing System The typical job order inventory accounts use actual direct materials, actual direct labour costs combined with predetermined overhead rates multiplied by some actual cost driver. This method of valuation (normal) is used because actual direct materials and direct labour costs are fairly easily identifiable and are associated with a particular job. Manufacturing overhead costs are not usually traceable to specific jobs and must be allocated to production. © 2007 by Nelson, a division of Thomson Canada Limited.
Job Order Costing System The output of a given job can be a single unit or multiple similar or dissimilar units. For example, one business could order a set of business cards from a printer. Another company could order business cards for every employee from the printer. Another firm could order business cards, coloured product brochures, and letterhead from the printer. © 2007 by Nelson, a division of Thomson Canada Limited.
Job Order Costing: Details and Documents Stages of Existence 1. order confirmed 2. jobs in process 3. completed jobs © 2007 by Nelson, a division of Thomson Canada Limited.
Job Order Costing: Details and Documents Materials Requisition Form – a source document that indicates the types and quantities of materials to be placed into production or used in performing a service; causes materials and their costs to be released from the raw materials warehouse and sent to Work-In- Process Inventory (direct materials) and/or Overhead (indirect materials) The journal entry will be Work-In-Process Inventory XXX Manufacturing Overhead XXX Raw Material Inventory XXXX © 2007 by Nelson, a division of Thomson Canada Limited.
Job Order Costing: Details and Documents Job Order Cost Sheet – a source document that provides virtually all the financial information about a particular job; the set of all job order cost sheets for uncompleted jobs composes the Work-In-Process Inventory subsidiary ledger The total costs contained in all job order cost sheets for uncompleted jobs should reconcile to the Work-In-Process Inventory control account. When you go to your garage for repair or maintenance work on your car, the form that is completed upon your arrival is the job order cost sheet. © 2007 by Nelson, a division of Thomson Canada Limited.
Job Order Costing: Details and Documents Employee time sheet (time ticket) – a source document that indicates, for each employee, what jobs were worked on during the day and for what amount of time Time spent on each job by the employee is multiplied by the wage rate. The summations are recorded on the appropriate job cost sheets. Direct and indirect labour are charged to Work-In-Process and Manufacturing Overhead respectively. The journal entry is Work-In-Process Inventory XXX Manufacturing Overhead XX Wages Payable XXXX © 2007 by Nelson, a division of Thomson Canada Limited.
Job Order Costing: Details and Documents Overhead Actual overhead is accumulated in the Manufacturing Overhead account during the period. The entry is Manufacturing Overhead XXX Cash / Accounts Payable / Accumulated Depreciation / etc. XXX © 2007 by Nelson, a division of Thomson Canada Limited.
Job Order Costing: Details and Documents Overhead If predetermined rates are used, overhead is applied at the end of the period or on completion of production, whichever is earlier. The entry is Work-In-Process Inventory XXX Manufacturing Overhead XXX © 2007 by Nelson, a division of Thomson Canada Limited.
Job Order Costing: Completion of Production On completion of a job, its total cost is transferred to Finished Goods Inventory account. The entry is Finished Goods Inventory XXX Work In Process Inventory XXX Job cost sheets for completed jobs are transferred to a Finished Goods file and become a subsidiary ledger for that account. © 2007 by Nelson, a division of Thomson Canada Limited.
Job Order Costing: Completion of Production When the goods are sold, the cost shown on the job cost sheet is transferred to Cost of Goods Sold. The entry is Cost of Goods Sold XXX Finished Goods Inventory XXX © 2007 by Nelson, a division of Thomson Canada Limited.
Job Order Costing: Completion of Production • Job sheets become permanent files. • provides a historical summary about total costs • helpful for planning and control purposes • helpful for bidding on future contracts • profitable jobs lead management to pursue • additional similar jobs • unprofitable jobs will result in analysis to see if • cost control was lax © 2007 by Nelson, a division of Thomson Canada Limited.
Process Costing • Process Costing – a method of • accumulating and assigning costs • to units of production in companies • that make large quantities of • homogeneous product • Costs are accumulated by • process or operation • Products flow sequentially from • one department to the next • A Work-In-Process account is • maintained for each department • (process or operation) © 2007 by Nelson, a division of Thomson Canada Limited.
Differences Between Job Order and Process Costing • Process Costing • Costs accumulated by • process • WIP – production • report for each batch • Homogeneous products • Produce for inventory • Job-order costing • Costs are accumulated by job • WIP has a job-cost sheet for • each job • Heterogeneous products • Produce to order © 2007 by Nelson, a division of Thomson Canada Limited.
Flow of Costs Through Production Physical Delivery Raw Material Processing Finished Good Customers Storeroom Unit Warehouse Direct Direct Labour DM, DL, and Material $ and MOH $ MOH $ Cost Raw Materials Inventory Work-in- Process Inventory Finished Goods Inventory Cost of Goods Sold © 2007 by Nelson, a division of Thomson Canada Limited.
Department One Department Two Material Requisition Documents Employee Timesheets Adjusting Journal Entries Material Requisition Documents Employee Timesheets Adjusting Journal Entries Raw Direct Factory Raw Direct Factory Material Labour OverheadMaterial Labour Overhead Input Costs Assigned to Products Input Costs Assigned to Products Product A Product A Product B Product B Product C © 2007 by Nelson, a division of Thomson Canada Limited.
Production Costs • Direct material cost is calculated from material requisition slips and invoiced prices • Direct labor cost is determined from employee time sheets and wage rates • Overhead costs are assigned through use of predetermined rates or actual costs © 2007 by Nelson, a division of Thomson Canada Limited.
Accumulating Costs • Production costs = Material + Labor + Overhead • Costs are assigned to each process during the period • Unit costs are determined for each cost component and each process • Cost of completed unit = Sum of costs per unit for all processes through which product passes © 2007 by Nelson, a division of Thomson Canada Limited.
Accumulating Costs For production to begin, some direct material must be introduced. Most production processes require more than one direct material. Additional materials may be added at any point, or may be added continuously. Materials may even be added at the end of the process. When direct labour and overhead are incurred at the same rate, these two components can be combined as conversion cost. © 2007 by Nelson, a division of Thomson Canada Limited.
Quantity of Production Process costing assigns costs to both fully and partially completed units by converting partially completed units to equivalent whole units or to equivalent units of production (EUP). © 2007 by Nelson, a division of Thomson Canada Limited.
Equivalent Units of Production + and OR Equivalent units of production (EUP) – an approximation of the number of whole units of output that could have been produced during a period from the actual effort expended during that period © 2007 by Nelson, a division of Thomson Canada Limited.
Equivalent Units of Production Use of EUP requires recognition of two factors related to inventory. 1. Units in beginning WIP Inventory were started last period but will be completed during the current period. Some costs were incurred in the prior period and some costs will be incurred in the current period. 2. Partially completed units in ending WIP Inventory were started in the current period, but will not be completed until the next period. Ending WIP Inventory includes all costs incurred during the current period. Additional costs will be incurred in the next period to complete the units. © 2007 by Nelson, a division of Thomson Canada Limited.
Process Cost Valuation • End of period requirements – • Value ending Work-In-Process Inventory • Value goods transferred to next department • HOW • 1. Weighted average method • 2. FIFO (first-in, first-out) method © 2007 by Nelson, a division of Thomson Canada Limited.
Two Process Costing Methods Weighted average method – a method of process costing that computes an average cost per EUP; combines beginning inventory units with current production and beginning inventory costs with current costs to compute that average FIFO method – a method of process costing that computes an average cost per EUP using only current production and current cost information; units and costs in beginning inventory are accounted for separately © 2007 by Nelson, a division of Thomson Canada Limited.
Two Process Costing Methods • Weighted average (WA) method • Computes average cost per unit of production • Focuses on units completed during period and units that remain in ending WIP • FIFO method • Keeps beginning inventory and current period production and costs separated © 2007 by Nelson, a division of Thomson Canada Limited.
Steps in Process Costing 1. Calculate physical units to account for. 2. Calculate physical units accounted for. (Verify that step 2 equals step 1.) 3. Determine EUP. 4. Determine the total cost to account for. 5. Calculate the cost per equivalent unit. 6. Assign the costs to inventories. (Verify that the total costs transferred out plus the costs in ending inventory equal step 4.) © 2007 by Nelson, a division of Thomson Canada Limited.
Steps in Process Costing The following information concerns production in the Shampoo Bottling Department of Brash and Sassy for February. Material is added at the beginning of the process. Conversion takes place continuously during the process. Brash and Sassy uses the weighted average method. Units Beginning WIP inventory 1,200 (80% complete as to conversion) Started during the period 4,800 Completed and transferred out 5,000 Ending WIP inventory 1,000 (40% complete as to conversion) Cost of beginning WIP Inventory Direct material $ 42,000 Conversion cost 20,000 Total $ 62,000 Current period costs Direct material $150,000 Conversion costs 81,680 Total $231,680 © 2007 by Nelson, a division of Thomson Canada Limited.
Steps in Process Costing Step 1. Calculate the total units to account for Units in Beginning WIP Inventory 1,200 Units started during the current period 4,800 Units to account for 6,000 Step 2. Calculate the total units accounted for Units completed and transferred out 5,000 Units in ending WIP inventory 1,000 Units accounted for 6,000 © 2007 by Nelson, a division of Thomson Canada Limited.
Where are the Units? Transferred Out Next Month A B B March C (Started, Completed) Last Month D E D January This month February February 1 February 28 A represents work done in January (January 31 WIP inventory). B, C, and D represent work done in February: B is the work to complete A; C is units that were started and completed in February; D is units started in February, but not completed (February 28 WIP). E represents work that will be done in March to complete D. © 2007 by Nelson, a division of Thomson Canada Limited.
Weighted Average Cost A+B+C+D Equivalent Units of Production OR A to D © 2007 by Nelson, a division of Thomson Canada Limited.
Where are the Units? Units started and completed – the total units completed during the period minus the units in beginning WIP inventory; alternatively, units started minus units in ending WIP inventory January February March ABCDE Materials 1,200 -0- 3,800 1,000 -0- Conversion 960 240 3,800 400 600 Calculations Materials and Conversion (Started and completed in February): C = 5,000 completed – 1,200 in BWIP (started in January) = 3,800 Conversion: A 1,200 x 80% complete as to conversion = 960 B 1,200 x 20% (completion of units in A) = 240 D 1,000 x 40% (complete as to conversion) = 400 E 1,000 x 60% to be completed next period = 600 © 2007 by Nelson, a division of Thomson Canada Limited.
Steps in Process Costing Step 3. Determine the equivalent units of production MaterialConversion BWIP (80%) (A) 1,200 960 BWIP (completion) (B) 0 240 Started and Completed (C) 3,800 3,800 EWIP (40%) (D)1,000 400 Equivalent units of production 6,000 5,400 Note: A + B + C for both material and conversion is equal to the number of units completed and transferred out during February (5,000 units). © 2007 by Nelson, a division of Thomson Canada Limited.
Steps in Process Costing Step 4. Determine the total cost to account for MaterialConversionTotal Beginning WIP $ 42,000 $ 20,000 $ 62,000 Current period 150,00081,680231,680 Costs to account for $192,000$101,680$293,680 Step 5. Calculate cost per EUP [Cost per EUP = material, conversion to account for (from step 4) / EUP (from step 3)] EUP 6,000 5,400 Cost per EUP $32.00 + $18.83 = $50.83 © 2007 by Nelson, a division of Thomson Canada Limited.
Steps in Process Costing Step 6. Assign costs to inventories Transferred out (5,000 x $50.83) $254,150 Ending WIP Inventory Material (1,000 x $32.00) $32,000 Conversion (400 x $18.83) 7,532 39,532 Costs accounted for $293,682* * rounding © 2007 by Nelson, a division of Thomson Canada Limited.
Cost of Production Report Cost of production report – a document used in a process costing system; details all manufacturing quantities and costs, shows the computation of cost per EUP, and indicates the cost assignment to goods produced during the period © 2007 by Nelson, a division of Thomson Canada Limited.
Process Costing in a Multi-Departmental Setting Most companies have multiple department processing facilities. Manufacturing costs always follow the physical flow of goods. The costs of completed units of predecessor departments are treated as input material costs in successor departments. The additional cost component is called transferred-in or prior department cost. This component always has a percentage completion factor of 100%. The transferred in element is handled the same as any other cost element in the calculations of EUP and cost per EUP. A successor department may add additional raw material to the units that have been transferred in or may simply provide additional labour and overhead. © 2007 by Nelson, a division of Thomson Canada Limited.
Process Costing in a Multi-Departmental Setting • At Brash & Sassy, after being bottled, the product is transferred to the Packaging Department. Information on the following slide highlights production in the Packaging Department for February. Material is added at the beginning of the process. The Cost of Production Report for the Packaging Department follows. The main differences: • A column has been added for Transferred In units. • Costs are transferred in as well as units, and are included in the report. • Unit costs are calculated for transferred in items. • These unit costs are added to material and conversion costs to arrive at the total unit cost. © 2007 by Nelson, a division of Thomson Canada Limited.
Process Costing in a Multi-Departmental Setting Units Beginning WIP inventory 1,000 (60% complete as to conversion) Transferred in during the period 5,000 Completed and transferred out 4,600 Ending WIP inventory 1,400 50% complete as to conversion) Cost of beginning WIP Inventory Transferred In $ 50,000 Direct material 15,000 Conversion cost 17,000 Total $ 82,000 Current period costs Transferred In $254,148 Direct material 105,000 Conversion costs 72,000 Total $431,148 © 2007 by Nelson, a division of Thomson Canada Limited.
© 2007 by Nelson, a division of Thomson Canada Limited. *rounding
Process Costing Using FIFO Valuation The FIFO method does not commingle units and costs of different periods. Equivalent units and costs of beginning WIP inventory are withheld from the computation of the average unit current period cost. Steps 1 and 2 are the same for FIFO as for weighted average. They involve the use of physical units. Based on data from Brash & Sassy Mixing Department, the total units to account for and accounted for are 6,000. © 2007 by Nelson, a division of Thomson Canada Limited. Appendix 4A
FIFO Cost B + C + D Equivalent Production OR (A to D) - A Step 3. Determine the equivalent units of production MaterialConversion BWIP x 1 - .8 (completion) (B) 0 240 Started and Completed (C) 3,800 3,800 WIP (40%) (D)1,000 400 Equivalent units of production 4,800 4,440 © 2007 by Nelson, a division of Thomson Canada Limited. Appendix 4A
FIFO Cost Step 4. Determine the total cost to account for MaterialConversionTotal Beginning WIP $ 42,000 $ 20,000 $ 62,000 Current period 150,00081,680231,680 Costs to account for $192,000$101,680$293,680 Step 5. Calculate cost per EUP Cost per EUP = Current Period Cost FIFO EUP Current period costs 150,00081,680 FIFO EUP 4,800 4,440 FIFO Cost per EUP = $31.25 + = $18.40 = $49.65 © 2007 by Nelson, a division of Thomson Canada Limited. Appendix 4A
FIFO Cost From Opening Inventory Transferred Out + From Current Production Step 6. Assign costs to inventories Transferred out: 1. From Opening Inventory $ 62,000 2. From Current Production: Cost to complete BWIP (240 x $18.40) 4,416 Started and completed (3,800 x $49.65) 188,670 Transferred to Molding Department $255,086 EWIP: Material (1,000 x $31.25) $31,250 Conversion (400 x $18.40) 7,360 38,610 Costs accounted for* $293,696 *rounding Appendix 4A © 2007 by Nelson, a division of Thomson Canada Limited.