Download
1 / 16
190 likes | 562 Vues
Bias, Item Response Theory, and Mixed-Models. Nathan T. Carter Bowling Green State University Presented at the University of Central Florida, June 2010. Today’s Talk. What is bias? Overview of Item Response Theory (IRT) Differential Functioning Mixed-Model Item Response Theory (MM-IRT)

E N D
Bias, Item Response Theory, and Mixed-Models Nathan T. Carter Bowling Green State University Presented at the University of Central Florida, June 2010
Today’s Talk • What is bias? • Overview of Item Response Theory (IRT) • Differential Functioning • Mixed-Model Item Response Theory (MM-IRT) • Definition and Details • How to Use MM-IRT
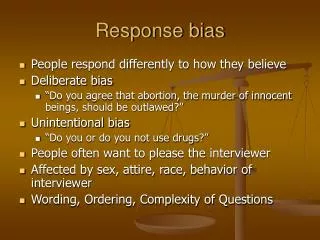
What is bias? • A concept first and foremost • Contamination of a measure • Do scores differ based on irrelevant sources? • Are differences due to the trait or something else? • Common concerns in applied settings • Protected classes (e.g. Race, sex) • Language adaptations • Should be a concern for any comparison of groups
What is Bias? (Cont.) • Common Frameworks • Confirmatory Factor Analysis • Good for structural questions • E.g., Does dimensionality of the measure hold? • Item Response Theory* • Good for item-level, unidimensional measures • Preferred model for psychologists (Borsboom, Romeijn, & Wicherts, 2008)
What is item response theory? • Theories of how responses relate to attributes • Many models • Essentially regression models • Item Response Functions (IRFs) • What determines persons’ probability of saying ‘x’? • q – The latent trait estimate • Location/difficulty • Discrimination/sensitivity
Dichotomous vs. Polytomous models, or IRFs vs. ORFs Dichotomous Model (2 options) Polytomous Model (More than 2 options)
IRT and Bias: Differential functioning • IRFs/ORFs are compared • A priori groups (e.g. race) • Do groups have different response-attribute relationships? • Statistical tests • Graphical analysis • Group 1 vs. Group 2 • Less extreme for G1 • Not as sensitive for G1 Group 1 Group 2
The Problem with Differential Functioning • Requires a priori groupings • Misspecified Groups • Example: Race and Socioeconomic Status • We find DIF based on Race • What if 70% of one Race are low SES!? • Can only use “observed” groups • What if there is bias because of latent differences!? • Can only use groupings • What if the source of bias is a continuous variable!?
Mixed-Model Item Response Theory to the Rescue! • MM-IRT • Combines features of IRT with Latent Class Analysis • Basically “Exploratory DIF” • Why is this called “Mixed” Models? • “Unmixes” the overall IRFs • Finds significantly different IRFs • “Latent Classes” – Assigns each person to a group IRF for full sample
How MM-IRT Can Be Used (Adapted from Carter et al., in press) • 1) Before Collecting Data: • Background/Review of the Measure and Others like it • 2) Determine the Appropriate Number of Classes • Estimate the 1-class solution, the 2-classes, then 3… • Continues until fit does not improve • This assesses RELATIVE Fit of these models • 3) Assess Absolute Fit • Be sure that there is good item-level fit • No reference to models with other numbers of classes • 4) Name the Classes • Helps to be less confusing to you AND the reader • Base names on RESPONSE BEHAVIOR • Category Probability Histograms for Each Class
How MM-IRT Can Be Used (Adapted from Carter et al., in press) • 5) Determine Influence of Response Sets (If Possible) • Can only be done with multi-scale measures (E.g. 16PF, JDI) • Are people in the same group across scales? • Analyze contingency tables • 6) Assess Correlates of Class Membership • Determine from past research or applied needs • Race, sex, and individual difference variables (e.g. Trust in Management) • Use logistic regression to predict class membership • (See Carter et al., in press; Hernandez et al., 2007) • Integrate covariates into the MM-IRT model • (See Meij de Maij et al., 2008; Tay et al., in press) • Requires a good deal of programming expertise
Some MM-IRT Applications in the organizational literature • Eid & Rauber (2000) • Leadership Satisfaction measure – 2 Classes • One used whole response scale, other used only extremes • Length of service and level Using whole scale may be too complex • Zickar et al. (2004) • Sample 1 – Found 3 extents of faking • None, Slight, Extreme • Sample 2 – Attempted to Recover Experimental faking conditions • Honest, Adlib, and Trained Conditions • Recovered an Honest class and a Faking class • Did not fall neatly into these categories • Shows the inherent complexity in detecting faking
Some MM-IRT Applications in the organizational literature (Cont.) • Maij-de Meij et al., 2008; Carter et al., in press • Amsterdam Biographical Questionnaire and Job Descriptive Index, respectively • Both use “Yes” / “No” / “?” scales • Found 3 classes – Each class prefers one of these 3 options regardless of their attribute standing • What predicted class membership? • Ethnic background (both) • Social Desirability (Maij-de Meij et al.) • Trust in Management predicts preferring use of the “?” in the JDI (Carter et al.)
Summary • Practical Advantages of MM-IRT • Does not require a priori groups • Traditional DF may obscure what’s really happening (i.e. example with race and SES) • Allows for using continuous variables as bias sources • Better power in some cases • Can compare several groups without an unnecessary number of statistical tests • Traditional DIF – Each group is compared to a “Reference” group • Searches for groups FOR the researcher
Summary (cont.) • Some Disadvantages • Very large number of respondents needed • Number of response patterns observed vs. number of POSSIBLE patterns (a large number) • Lack of clarity in solutions • Can be helped by careful analysis • Parsimony is key! • May have to pore over dataset for a LONG time! • May not be an easy way to “name” them
Questions? Comments? • Thank you for having me!