Download
1 / 62
620 likes | 743 Vues
This report details the global foreign exchange (FX) and interest rate outlook as of October 2010, emphasizing the relationship between financial conditions and monetary policy. It explains how changes in policy rates influence various economic factors such as inflation, consumer behavior, and lending practices. Important metrics, including Bloomberg’s Financial Conditions Index, are analyzed as indicators of economic health. The discussion also covers the Federal Reserve's approach to managing interest rates and the implications for GDP growth and inflation expectations.

E N D
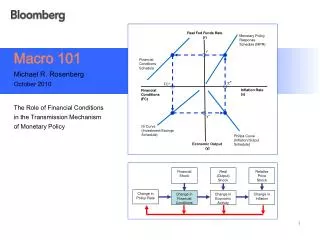
Image page Global FX and Interest Rate Outlook Michael R. Rosenberg October 2010
Bulletedpage Interest Rate Outlook FCW <go>
Bulletedpage Financial Shock Real (Output) Shock Relative Price Shock Change inPolicy Rate Change in Financial Conditions Change in Economic Activity Change in Inflation Financial Conditions and the Monetary Policy Transmission Mechanism “Monetary policy works in the first instance by affecting financial conditions, including the levels of interest rates and asset prices. Changes in financial conditions in turn influence a variety of decisions by households and firms, including choices about how much to consume, to produce, and to invest.” Federal Reserve Chairman Ben S. Bernanke, March 2, 2007 Source: Bloomberg
Bulletedpage How Financial Conditions Typically Respond to Federal Reserve Policy Changes Change in Financial Conditions Change in Money-Market Rates Change in Government Bond Yields Change inCredit Spreads Change in PolicyRate Change in Economic Activity Change in Inflation Change in Asset Prices Change in Bank Lending Conditions Source: Bloomberg
Bulletedpage Bloomberg’s Financial Conditions Index Significantly Above Normal Normal Significantly Below Normal Source: Bloomberg BFCIUS index <go>
Bulletedpage Tracking Financial Conditions –Bloomberg’s Financial Conditions Index Source: Bloomberg
Bloomberg Financial Conditions Index as a Leading Indicator of Bank Lending Conditions U.S. Bank Willingness to Lend(Smoothed Index) Financial Conditions(Smoothed Index) Bank Lending Conditions Financial ConditionsIndex Source: Bloomberg
Bloomberg Financial Conditions+ Index as a Leading Indicator of Real GDP Growth U.S. Real GDP Growth (yoy % chg.)(Smoothed) Financial Conditions(Smoothed Index) Bank Lending Conditions Financial ConditionsIndex Source: Bloomberg
Bulletedpage Monetary Policy Works by Affecting Financial Conditions, Even When the Policy Rate is Zero Alter Size and Composition of Central Bank’s Balance Sheet Quantitative Easing Channel Change inPolicy Rate Traditional Channel Change in Financial Conditions Change in Economic Activity Change in Inflation Rate Commit to Keep Policy Rate Low for a Considerable Period Expectations Management Channel Source: Bloomberg 8
Bulletedpage Federal Reserve Targeting Long-Term Rather than Short-Term Interest Rates Change inShort-Term Policy Rate Traditional Channel Change in Financial Conditions Change in Economic Activity Change in Inflation Rate Change in Long-Term Interest Rate NewApproach 9 Source: Bloomberg
Bulletedpage Taylor Rule Estimates of the Fed Funds Rate –1990-2010 Source: Bloomberg TAYL <go>
Bulletedpage Fed Funds Rate and U.S. Core Inflation Rate Fed Funds Rate Core PCE Inflation Rate Source: Bloomberg G <go>
U.S. Real Fed Funds Rate and the U.S. Unemployment Gap Fed Funds Rate less PCE Inflation (%) U.S. Unemployment Rate less NAIRU (%) Unemployment Gap Real Fed Funds Rate Source: Bloomberg 12
Bulletedpage CBO Projections of U.S. Output Gap Output Gap (%) Output GapProjections Source: Board of Governors of the Federal Reserve System and Bureau of Economic Analysis;Note: Output gap equals actual minus potential GDP.
Bulletedpage CBO Projections of U.S. Unemployment Gap Unemployment Gap (%) Unemployment Gap Projections Source: Board of Governors of the Federal Reserve System and Bureau of Economic Analysis;Note: Actual minus the Natural Rate of Unemployment.
Fed Funds Rate Outlook – A Taylor Rule Perspective Fed Funds Rate (%) Fed Funds Rate Estimates Using Fed Projected Inflation & Unemployment Modified Taylor Rule Estimates Source: Bloomberg
Federal Reserve Bank of San Francisco’s Fed Funds Rate Outlook Source: Glenn D. Rudebusch “The Fed's Exit Strategy for Monetary Policy”, FRBSF Economic Letter, June 14, 2010
Fed Funds Rate and U.S. Bank’s Commercial & Industrial Loans Following the 1990-91 and 2001 Recessions First Rate Hikeafter 1990-91 Recession First Rate Hikeafter 2001 Recession Fed Funds Rate (%) Growth in C&I Loans (y-o-y %) C&I Loans Fed Funds Rate Source: Bloomberg
U.S. Five-Year Treasury Yields and U.S. Nominal GDP Growth – 1993-2010 Long-term interest rates were too low relative to the level of economic activity throughout 2002-06 (%) Source: Bloomberg 18
Private Economist and FOMC Projections of Nominal GDP Growth Source: Bloomberg ECFC Composite Analyst Forecasts; Federal Reserve Board
Image page Key Drivers of U.S. Bond Market Rally Signs of renewed U.S. economic weakness U.S. inflation expectations have fallen sharply Downward revision in where the market see U.S. short-term interest rates heading Surge in the demand for safe-haven assets in the wake of the sovereign debt crisis Mutual fund portfolio flows out of equities and into bonds Expected increase in Federal Reserve purchases of U.S. Treasuries as part of a new, stepped-up quantitative easing initiative Source: Bloomberg
Bulletedpage ECRI Leading Economic Indicator of U.S. Economic Growth 2001-02 Worldwide Recession 1990-92 Recession 1980-82 Recession 2007-10 Financial Crisis/Recession 1974-75 Recession 21 ECRWGROW Index GP <go> Source: Bloomberg
U.S. 10-Year Implied Breakeven Inflation Rate 70+ Basis-Point Decline in 10-Year Breakeven Inflation Rate USGGBE10 Index GP <go> Source: Bloomberg
Expectations of Three-Month T-Bill Rates in Two-Year’s Time Downward Revision in Expectations of Three-Month T-Bill Rates in Two-Years’ Time G0025 2Y3M Curncy GP <go> Source: Bloomberg
U.S. Long-Term Interest Rates and the Projected Path of Short-Term Interest Rates 10-Year Treasury Yield Expectations of Three-Month T-Bill Rates Source: Bloomberg
Bulletedpage Mutual Fund Portfolio Flows into Bond Funds Soar in 2010 (US$ bn) Dec. 2009 July 2010 Dec. 2009 July 2010 Dec. 2009 July 2010 Source: ICI, “Trends in Mutual Fund Investing”, July 2010.http://www.ici.org/research/stats/trends/trends_07_10
Estimating the Impact of the Federal Reserve's Large-Scale Asset Purchase Program on Long-Term Interest Rates Source: Joseph Gagnon, "The World Needs Further Monetary Ease, Not an Early Exit", Peterson Institute for International Economics Policy Brief, December 2009.
Bulletedpage U.S. Bond Market Rally – A Supply and Demand Perspective U.S. Long-Term Interest Rates Bs1 Bd1 Bs2 Bd2 B i2 i1 Despite the increase in publicly held debt outstanding (from Bs1 to Bs2), an increase in the demand for U.S. Treasuries (from Bd1 to Bd2) has pushed interest rates down (from i1 to i3). A C i3 Debt Level1 Debt Level2 Outstanding Stock of Publicly Held U.S. Government Debt Source: Bloomberg 27
Bulletedpage Federal Reserve Large-Scale Asset Purchase Program – A Supply and Demand Perspective U.S. Long-Term Interest Rates Bs2 Bs1 Bd1 A i1 i2 Fed purchases reduce the supply of publicly held debt outstanding (from Bs1 to Bs2), thereby pushing interest rates down (from i1 to i2). B Debt Level2 Debt Level1 Outstanding Stock of Publicly Held U.S. Government Debt Source: Bloomberg 28
Bulletedpage Supply and Demand for U.S. Government Debt and the Risk Premium on U.S. Debt U.S. Long-Term Interest Rates BSupply1 BSupply2 BSupply3 BDemand (i3) Investors require higher interest rates as they are asked to add significant amounts of additional debt to their portfolios (i2) (i1) D1 D2 Outstanding Stock of Publicly Held U.S. Government Debt D3 Source: Bloomberg 29
Image page Estimating the Interest-Rate Effects of Changes in Outstanding U.S. Government Debt Source: Federal Reserve Board Discussion Paper 2003-12.
IMF Estimates of U.S. Treasury Bond Issuance on U.S. Long-Term Bond Yields Source : Oya Celasun and Martin Sommer, "The Financing of U.S. Federal Budget Deficits", IMF Country Report No. 10/248, July 2010. www.imf.org/external/pubs/ft/scr/2010/cr10248.pdf
U.S. Federal Debt Held by the Public – 1790-2035 Source : Congressional Budget Office, Economic and Budget Issue Brief, “Federal Debt and the Risk of a Fiscal Crisis”, July 27,2010 http://www.cbo.gov/ftpdocs/116xx/doc11659/07-27_Debt_FiscalCrisis_Brief.pdf
Bulletedpage Median Real GDP Growth and Debt/GDP Ratios in Select Advanced Economies – 1790-2009 Real GDP Growth (yoy %) Source: Carmen Reinhart and Kenneth Rogoff, “Debt and Growth Revisited”, VOX, August 2010. http://www.voxeu.org/index.php?q=node/5395
Bulletedpage Exchange Rate Outlook FXMI <go>
Bulletedpage FX Trader Performance – 1994-2010 6.9% Average Annual Return 1995-2003 1.6% Average Annual Return 2004-2010 FXTP <go> Source: Bloomberg
Bulletedpage Long-Term Trends in the U.S. Dollar’s Value 5-Year Uptrend 10-Year Downtrend 6-Year Uptrend 8-Year Downtrend 7-Year Downtrend 2008-10 Uptrend ? USTW$ index GP <go> Source: Bloomberg
Bulletedpage The Dollar and the Euro-U.S. Two-Year Yield Spread U.S. and Euro-area two-year bond yields reflect expectations of Fed and ECB policy rates for the next two years (US$/Euro) Euro-U.S. 2-Year Yield Spread (basis points) Source: Bloomberg
Image page Key Drivers of U.S. Bond Market Rally Signs of renewed U.S. economic weakness U.S. inflation expectations have fallen sharply Downward revision in where the market see U.S. short-term interest rates heading Surge in the demand for safe-haven assets in the wake of the sovereign debt crisis Mutual fund portfolio flows out of equities and into bonds Expected increase in Federal Reserve purchases of U.S. Treasuries as part of a new, stepped-up quantitative easing initiative Source: Bloomberg
Image page The U.S. Dollar’s 2010 PPP Undervaluation
Image page The Dollar’s PPP Over/Under-valuation vs. the Euro – 1990-2010
Bulletedpage A Stylized Model of the Dollar’s Long-Term Cycles From undervalued to fair valued to overvalued and back again US$ Value Maximum Overvaluation Maximum Overvaluation Time Maximum Undervaluation Maximum Undervaluation Maximum Undervaluation 5+ Years 5+ Years 5+ Years 5+ Years 5+ Years
Image page European Debt Crisis – Greece Credit Default Swap (CDS) Rate
Image page Key Determinants of the Long-Term Trend in the U.S. Dollar’s Value • Valuation • Carry • Risk Premia • Momentum
3x3 Passively Managed G-10 Carry-Trade Basket G-10 Short-Term Interest Rates Three-Month Euro-Deposit Rate (%) Long the 3 Highest Yielders Short the 3 Lowest Yielders Source: Bloomberg; as of October 5, 2010 44
Bulletedpage Long-Term Profitability & Drawdowns of a 3x3 G-10 Carry Trade Basket 2005-06Unwind 2007-08FinancialCrisis 1992ERM Crisis 1998Unwind of the Yen Carry Trade FXFB <go> Source: Bloomberg
3x3 Passively Managed Emerging-Market Carry-Trade Basket EM Short-Term Interest Rates Three-Month Euro-Deposit or NDF Rate (%) Long the 3 Highest Yielders Short the 3 Lowest Yielders Source: Bloomberg; as of April 13, 2010 46
Bulletedpage Long-Term Profitability & Drawdowns of a 3x3 EM Carry Trade Basket 2007-08FinancialCrisis 2005-06Unwind FXFB <go> Source: Bloomberg
Fundamental Drivers of Long-Run Carry-Trade Performance Cumulative Carry-Return Performance Trend Decline in Currency Risk Premium (4) Trend Decline in Inflation Expectations (3) Gradual Rise in Real Long-Run Equilibrium Exchange-Rate (2) Wide Short-Term Spreads Attract Capital Inflows (1) t0 t1 t2 t3 t4 Time
Image page Explaining the Persistence of Positive Excess Returns on Carry-Trade Strategies • High-yield currencies are more sensitive to changes in market volatility and asset-price trends. (High-yield currencies behave similar to high-beta stocks.) Because they entail greater systematic risk, they command higher expected returns. • High-yield currencies are subject to periodic crash risk. Excess returns represent the compensation for taking on that crash risk.