Download
1 / 15
150 likes | 262 Vues
This report presents the findings from the WISUTIL conference held in Vienna on September 26-27, 2011. Research by Maarten van Klaveren and Kea Tijdens focused on working conditions across three sectors: energy, water, and waste. The study analyzed occupational groups, educational attainment, skill levels, and job security concerns among workers. Insights reveal variations in training received, working hours, and the prevalence of over-qualification and job insecurity across different countries. The report offers valuable data for improving labor conditions in these critical sectors.

E N D
WISUTIL - Main findings on working conditions WISUTIL conference, Vienna, Austria 26-27 September2011 Maarten van Klaveren (AIAS) Kea Tijdens (AIAS)
Survey questions on occupation Search tree to identify occupation from a list of common occupations in energy, water and waste In the report, these occupations are clustered in 3 groups:(1) managers, professionals and technicians; (2) clerical staff and sales persons; (3) craft workers, operators and unskilled workers Survey questions on skills Survey question on highest educational attainment Survey question on over- and under-qualification Occupation and skill measurement
managers, professionals and technicians (red)-> all countries at least 5 in 10, in Denmark, Finland, Netherl.: 3 in 10 clerical staff, sales persons (green) -> all countries: 1 to 2 in 10 craft workers, operators and unskilled workers (pink) -> all countries: 2 to 3 in 10, in Denmark and Finland: 5 in 10 Occupational groups (distribution)
high educated (green) -> all countries: 4/6 in 10-> Denmark, Finland, Germany: 2 in 10 low educated (blue) -> all countries 1 in 10 -> Denmark, Germany: 4 in 10, Finland, Netherlands: 3 in 10 Note: ISCED classification covers vocational training poorly Educational groups (distribution)
overqualified (green) -> all countries: 2 in 10, in Finland, Spain, and United Kingdom: 3 in 10 rightly qualified (red) -> all countries at least 7 to 8 in 10 underqualified (blue) -> all countries: 1 in 20, in Belgium, Denmark, Italy and Netherl.: 1 in 10 Right education level?
Training in energy, water and waste (jointly) overall (pink) 5 to 8 in 10 has received training occ. group (1) (blue) received most training in all countries except Italy occ. group (2) (red) 5 to 7 in 10 workers received training -> Spain only 4 in 10; United Kingdom even 8 in 10 occ. group (3) (green) 5 to 7 in 10 workers received training -> Hungary 4 in 10 Training from employer last year?
overall (pink) 4 / 6 in 10 has been promoted, Poland not sufficient data occ. group (1) (blue) 4 / 6 in 10 in all countries occ. group (2) (red) 4 / 7 in 10 in all countries occ. group (3) (green) 4 / 7 in 10 in all countries, -> Denmark 3 in 10 Promoted in current firm?
measure: ‘worries never’ (=1) about job security to ‘worries daily’ (=5) ‘worries daily’ (black) is approx.1 in 10 in all countries-> in Italy 2 in 10; in Denmark and Sweden 1 in 20 ‘worries never’ (blue) is 2 / 3 in 10 in all countries-> in UK 1 in 10; in Germany and Netherlands higher than 3 in 10 average worries - level highest in UK (3.0), followed by Hungary (2.8)lowest in Sweden and Germany (2.2) Job security
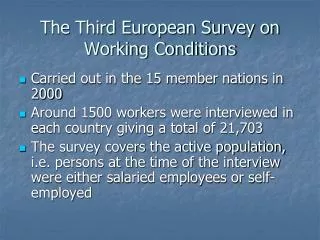
Survey questions on working hours: ‘How many hours per week do you work under the terms of your labour contract?’ ‘Do you usually work the number of hours laid down in your contract’ If no: ‘How many hours per week do you usually work?’ Workers without labour contract or without agreed hours are only asked about their usual hours Working hours measurement
1-32 hrs -> Finland and Netherlands 1 in 10, other countries less (black) 32-36 hrs -> France 3 in 10, other countries less than 1 in 10 (red) 36-40 hrs -> most common pattern in all countries (green) 40-44 hrs -> Germany 2 in 10, other countries less than 1 in 10 (pink) 44 and more -> Germany 3 in 10 , other countries less than 2 in 10 (blue) Length working week (distribution)
usual working hours longest in waste in all countries (blue) but not in France, Hungary, Italy and Spain usual working hours shortest in water in all countries (red) but not in France, Hungary, Italy and Spain usual working hours in between in energy (green)not in Belgium, Finland, France, Hungary, Poland, Spain, and Sweden Usual hours in energy, water, waste
percentages workers reporting usually working more hours than agreed-> France: 6 in 10 (effect of 35 hours’ working week)-> Germany: 5 in 10-> Finland and Poland: little overtime in the sub-sectors: in half of the countries overtime most frequent occurs in waste (green), whereas it occurs least frequent in water (red) Overtime in energy, water, waste
percentages workers reporting working shifts or irregular hours-> France: 6 in 10-> Italy: 5 in 10-> Hungary, Netherlands, Poland: 4 in 10-> other countries: 3 in 10 or 2 in 10 across sub-sectors, shift or irregular hours do not largely differ Shifts in energy, water, waste
percentages workers reporting working shifts or irregular hours-> France: 6 in 10-> Italy: 5 in 10-> Hungary, Netherlands, Poland: 4 in 10-> other countries: 3 in 10 or 2 in 10 across sub-sectors, shift or irregular hours do not largely differ Shifts in energy, water, waste
Thank you for listening! Comments invited m.vanklaveren@uva.nl k.g.tijdens@uva.nl The end