Download
1 / 22
220 likes | 352 Vues
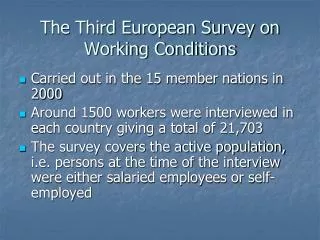
The Third European Survey on Working Conditions. Carried out in the 15 member nations in 2000 Around 1500 workers were interviewed in each country giving a total of 21,703

E N D
The Third European Survey on Working Conditions • Carried out in the 15 member nations in 2000 • Around 1500 workers were interviewed in each country giving a total of 21,703 • The survey covers the active population, i.e. persons at the time of the interview were either salaried employees or self-employed
Sample design • The sample design is a multi-stage random sampling, called ‘random walk’. • The identification of sampling points is based on the Eurostat territorial breakdown for each country (NUTS II) and population density. • The selected sample is weighted so that the sample is identical to the target population according to six variables: region, city size, gender, age, sector of activity and occupational category
Structure of the questionnaire • The questionnaire is divided into 8 basic sections • Section 1: Background information on the interviewee and his place of work (nationality, age, size of firm, sector of activity, etc.) • Section 2: Physical environment (basically designed to capture factors affecting health, safety and stress at work) • Section 3: Time (measures factors related to working time)
Structure of the questionnaire • Section 4: Organisational environment: captures work organisation (e.g. learning, problem-solving, complexity, repetition, team organisation, quality standards, etc. • Section 5: Social environment: mainly focuses on forms of communication and assistance received at work
Structure of the questionnaire • Section 6: Outcomes in terms of health, safety and job satisfaction • Section 7: Demographics: marital status, gender, structure of household • Section 8: Mainly information on payment system and level of earnings
Comparison of organisational modes for the EU-15 • Lorenz and Valeyre (2005, 2006) • Lorenz, Lundvall and Valeyre (2006) • Arundel, Lorenz, Lundvall and Valeyre (2006)
Field of study • Salaried employees working : • in establishments with at least 10 persons • in both manufacturing and services • Total population studied : 8 081 persons • Draws primarily on Section 4: Organisational environment
Table 1 Organisational Variables Source: Third Working Condition survey. European Foundation for the Improvement of Living and Working Conditions
A visual display of the first two factors of MCA analysis Team: team work Rot: job rotation Mono: task monotony Rep: task repetiveness Caut: automatic constraints on work pace Cnorm: quantitative norm constraints on work pace Chier: hierarchical constraints on work pace Chor: horizontal constraints on work pace
Summary of results for the 4-cluster solution (percent of employees in each cluster) Source : Third Working Condition survey. European Foundation for the Improvement of Living and Working Conditions
Differences in forms of work organisation by sectors, establishment sizes and occupations • ‘Discretionary learning’ forms of work organisation: • financial and business services; electricity, gas and water • managers; other executives; technicians • ‘Lean’ forms of work organisation: • manufacturing: vehicles; electrical end electronics; wood and paper • blue collars • increasing with the size • ‘Taylorist’ forms of work organisation: • manufacturing: textile, garments and leather; food processing; wood and paper; vehicles • machine operators and assemblers; unskilled workers • increasing with the size • ‘Simple structure’ or ‘traditional’ forms of work organisation: • services: land transport; personal services; trade • sales and service staff; unskilled workers • decreasing with the size
Table 3 Forms of Work Organisation by Sector of Activity (percent of employees by organisational class) Source: Third Working Condition survey. European Foundation for the Improvement of Living and Working Conditions
Table 4 Forms of Work Organisation according to Occupational Category (percent of employees by organisational class) Source: Third Working Condition survey. European Foundation for the Improvement of Living and Working Conditions
Table 5 National Differences in Organisational Learning Modes (percent of employees by organisational class) Source : Third Working Condition survey. European Foundation for the Improvement of Living and Working Conditions
Forms of work organisation across European nations • ‘Learning’ forms of work organisation: • + : Netherlands, Denmark and Sweden • - : Southern countries and Ireland • ‘Lean’ forms of work organisation: • + : UK, Ireland, Spain and France • - : Netherlands, Denmark, Sweden, Germany and Austria • ‘Taylorist’ forms of work organisation: • + : Southern countries and Ireland • - : Netherlands, Denmark and Sweden • ‘Simple’ forms of work organisation: • + : Southern countries • - : Netherlands, Denmark, Finland and UK
Table 8 Logit Estimates of National Effects on the Use of Work Organisation Forms * : significant at 5% ** : significant at 1% Reference country : Germany Source : Third European Survey of Working Conditions. European Foundation for the Improvement of Living and Working Conditions.
Exploring the links between organisational modes and innovative performance Figure 3 Figure 2
Figure 6 Figure 6
The relation between organisational modes and institutional context