Download
1 / 78
790 likes | 962 Vues
Facing Climate Changes: Towards Sustainable Planning and Management of Water Resources Prof. Ezio Todini. Main changes of Water Resources availability during the twentieth century

E N D
Facing Climate Changes: Towards Sustainable Planning and Management of Water Resources Prof. Ezio Todini
Main changes of Water Resources availability during the twentieth century Measurements of temperature, precipitation, discharges, groundwater levels, water quality, etc., provide an important reference framework on the availability of water resources and on the extent of their reduction, mostly caused by: the ongoing climatic changes the generalised over-exploitation of renewable sources the increased water pollution.
Main meteorological changes in Italy during the twentieth century Over the entire country the following changes have been observed: positive temperature trend, with induced increase in evapo- transpiration losses reduction of yearly precipitation totals spatio-temporal variation of distribution of rainfall events with: reduced formation of snow cover and shrinking of glaciers appreciable reduction of low and mean river flows increased rainfall intensity during storms with: increased probability of flood events
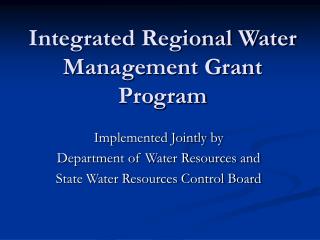
Normalised Yearly Rainfall Totals over Italy Annual and running mean values Year (Brunetti et al, 2006)
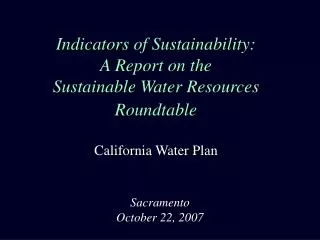
Space-time variation of rainfall over Italy • Winter • Spring • Summer • Autumn (Brunetti et al, 2001)
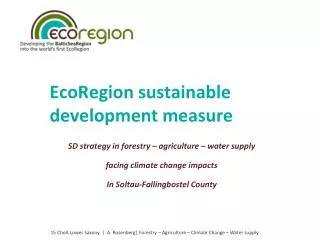
Reno Measured Discharge at Casalecchio (1923-1995) Year Spring Summer Autumn Winter
Predicted precipitation changes in Europe (Alcamo et al., 2007)
Predicted flood frequency changes in Europe (Kundzevicz et al., 2007)
Until the end of the ‘80, water was considered one of the natural resources to be exploited, and traditionally Planning and Management of Water Resources were approached via Deterministic or Stochastic Optimization (Maas et al., 1962; James and Lee, 1971; Loucks et al., 1981)
More recently, Multi-criteria Techniques have also been extensively used, in order to account for a wider variety of Commensurable and Incommensurable Objectives
At the end of the 80’ the introduction of the • Sustainability Concept • (World Commission on Environment and Development, 1987) • which aims at fulfilling: • Environmental integrity • Economic efficiency • Equity for present and future generations • has radically changed the traditional perspectives.
Sustainability Emerging Concepts - Water must be considered as a limiting factor for economic growth and development - Environmental aspects (especially water quality which may reduce water availability and quality of life) must be taken into consideration - Socio-economic aspects must be taken into account - Legal and political (local, national and international) issues (strategies, restrictions) must be considered - Uncertainty (including hydrological stochasticity, climate change and future demand) has to be accounted for
EMERGING REQIREMENTS Sustainability requires studying problems in a comprehensive way at catchment scale. Furthermore, with the introduction of the sustainability concept classical optimisation in water resources, has lost its leading role with respect to the analysis of environmentalandsocio-economicalimpacts of pre-defined development scenarios.
Planning sustainable resources exploitation requires • to take into account: • the present situation • the socio-economic context • - the availability of resources • - the environmental carrying capacity • In addition it is also necesary: • to place special attention on public requirements • which implies strong interactions with population.
Unfortunately Although the experience from developed countries indicates the need to establish a right balance between the market mechanisms and government interference as well as among technical/ technological aspects, energy management and social aspects, all the water development and allocation plans seem still to follow a top-down approach, where the “participatory approach” is only meant as trying to promote the “blessing” of the general public on already taken decisions .
Sustainability Can also be viewed as the capacity of reconciling high efficiency and effectiveness of interventions with the environmental compatibility and the actual needs and demands of the populations involved. NOTE that these may be significantly affected by the foreseen population growth and climatic changes, as anticipated by the IPCC.
Unfortunately, in absence of better political understanding of the drivers of sustainable development and of their complexity, economic growth remains the predominant driver for the policiesof most countries and territories. Short-term economic gains (especially in the conditions of low GDP) seem politically more attractive then the longer-term benefits associated with integration of sustainability requirements into policy making.
The basic requirements There is the need for shared objectives and participated “description” of all the aspects and facets that may result from the planned resources allocation and managementpolicies, which suffered in the past (and still frequently suffer today) of top down approaches.
In other words, more than the search for optimised policies, there is the need for a comprehensive description of the overall physical-environmental-social-economical system to make politicians, technicians and in particular stakeholders and end users, not only able to understand the advantages descending from the proposed strategies, but most of all, to be aware of the short and long termpositive and negative consequences that may arise from their implementation.
This description includes a fact finding and analysis phase, in which the real needs of the end users are established with a participatory approach, followed by a synthesis and communication phase, where the effort has to be placed into the definition of clear and understandable indicators. The clearness of indicators and the ways in which they are communicated to the stakeholders is a fundamental step towards participated decisions, as requested by the WFD.
It is in this context that alternative indicators to the GDP have been proposed in order to provide a more realistic measure of welfare, quality of life and quality of ecosystems and environment
Alternative indicators to GDP GNH– Gross National Happiness (Bhutan King Jigme Singye Wangchuck – 1972) GPI– Genuine Progress Indicator HPI – Happy Planet Index
THE NEED FOR INTEGRTED DECISION SUPPORTING TOOLS From all these aspects the need emerges for integrated planning and impact verification decision support tools, integrating over a geo-referenced database all the required models and tools to be used by planners to assess the consequences of interventions on a multiplicity of aspects, to navigate among the extremely large number of items and possibilities and to produce and implement development measures that will keep track ofthe environmental and socio-economic interactions, of public requirements and of administrative and legal viability.
Existing Decision Support Systems (DSS) tend to be too detailed in single model components and/or restricted to some of the aspects of the problem, without taking into comprehensively account for the complex interrelations among all the physical, socio-economical and environmental components
Examples of Existing Decision Support Systems • AQUATOOL – Polytechnical University Valencia • BASINS - US EPA • EGYPT DSS – ET&P • ENSIS – NIVA • IQQM - NSW Dept. Land and Water Cons. • IRAS – University of Cornell • MIKE BASINS - DHI • RIBASIM – Delft Hydraulics • SPATIAL DSS – NTUA • WATERWARE – Eureka 487 • WEAP – Stockholm Institute
AQUATOOL – Polytechnical University Valencia PROS General Water Resources Management at catchment scale CONS No economic and environmental aspects No link with GIS Does not allow dynamic inclusion of nodes
BASINS - US EPA PROS Environmentally oriented CONS Physical aspects description prevails over socio-economical impacts
IQQM - NSW Department of Land and Water Conservation PROS Mainly physical aspects Water quantity and quality simulation. CONS Does not include scenario concept. Not linked to a GIS
MIKE BASINS - DHI PROS Integrated GIS-DB Physical simulation and optimisation CONS No socio-economic and environmental impact
EGYPT DSS – ET&P PROS Comprehensive Includes Socio-economical, Environmental and Quality of Life indicators CONS Too complex as a generic tool
RIBASIM – Delft Hydraulics PROS Includes several models Performs water allocation CONS Does not allow for Environmental and Socio-Economical impacts Can import maps but does not provide GIS facilities
WATERWARE – Eureka 487 PROS Incorporates GIS and DB Open architecture CONS More information system than DSS Integration of components very expensive Scant documentation available
WEAP – Stockholm Institute PROS Comprehensive Based on DPSIR concepts CONS Does not include GIS/DB Water Demand cannot be updated through feedbacks at each time step
A new tool: the WaterStrategyMan DSS • A comprehensive DSS • Uses WFD and DPSIR concepts and approaches • Fully imbedded in ARC-GIS • Uses the ARC-GIS Geo-Database • Includes interactive and user friendly graphical tools • Includes default data, such as: • 1x1 kmGeotopo30 • 1x1 km FAO Soil Map of the World • 1x1 km Global Land Cover Characteristics Data Base • 10x10 km Monthly average climatology • Allows for multi-criteria analysis of indicators
Objectives of the WSM DSS • To support the strategy analysis at regional level • To compare strategies on the basis of different indicators • To help decision-makers to decide upon the best strategy, taking into account: • Regional development priorities • Social and economic constraints • Environmental constraints • Local, national or international legal constraints and directives
The Four Main Functions of the DSS • Describe the existing state of the water system • Assessstate in terms of: • Sources • Usage • Water cycles • Environmental quality • Forecast state on the basis of: • Assumed or envisaged scenarios • Technical alternatives • Management policies and actions • Evaluate impacts of actions
Demand and Supply Schematization • SUPPLY NODES DEMAND NODES • Renewable Groundwater Settlement • Fossil Groundwater Tourist site • Coastal Zone Irrigation Site • River Reach Industrial Site • Reservoir (Storage – Small – Natural Lake) Animal Breeding • Importing Exporting • Hydro-electricity production • TRANSHIPMENT NODES LINKS • Network Reservoir Canal • Pipeline • River Link • Groundwater Link • Return Flow Link
Current Patterns of water availability and use BaselineScenario Policy Options Strategy Definition Scenario + Strategy WaterAllocation ScenarioEvaluation Strategy Evaluation The Analysis Procedure
Generation of demand scenarios on population growth rates
Seasonal Demand: Irrigation Seasonal Demand: Tourism
Generating hydrological scenarios and seasonality
Reduction of network losses Desalination Water Reuse
Building a strategy from actions and schedule