Download
1 / 44
440 likes | 543 Vues
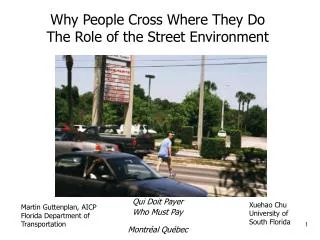
Explore the factors influencing pedestrians' choices in crossing streets, addressing safety and accessibility concerns in urban environments in Montreal, Quebec. Identify key elements impacting decision-making processes and propose policy interventions for enhanced pedestrian experience.

E N D
Why People Cross Where They DoThe Role of the Street Environment Qui Doit Payer Who Must Pay Montréal Québec Xuehao Chu University of South Florida Martin Guttenplan, AICP Florida Department of Transportation
Outline • Background and Context • Motivation • Research Questions • Data Gathering • Results • Conclusions
Acknowledgement • The Florida Department of Transportation provided funding through the National Center for Transit Research. District Seven of the Florida Department of Transportation performed the traffic counts and HARTline provided bus transportation. Mulitimodal LOS resources can be found at: http://www.dot.state.fl.us/planning/systems/sm/los/default.htm
Need for Multimodal Quality of Service Analyses • TEA-21 – mainstream • Transit, pedestrian, bicycle into • Planning, design, operations • Desires • Traveling public • MPOs (Transportation planning entity for urbanzied areas) • Local governments • Florida Statutes (Florida’s Transportation and Land Use Study Committee)
The Transportation and Land Use Study Committee FINAL REPORT January 15, 1999 Charge - Evaluate transportation and land use planning and coordination issues in Florida • 40 recommendations • #3 - Allow multimodal transportation districts • #4 - Local governments are encouraged to employ alternative techniques for measuring level of service, including multimodal
The Transportation and Land Use Study Committee FINAL REPORT January 15, 1999 HB-17 Legislation resulted from Transportation and Land Use Study Committee report • 163.3180 (1)(b) now states: • Local governments shall useprofessionally accepted techniquesfor measuring level of service for automobiles, bicycles, pedestrians, transit and trucks. These techniques may be used to evaluate increased multimodal accessibility and reduced VMT in an area. • FDOT shall develop methodologies to assist local governments in implementing this multimodal level of service analysis • DCA and FDOT will provide technical assistance to local governments in applying these methodologies
In Response to Legislation FDOT has: • Developed level of service methodology for pedestrian, bicycle, and transit modes • Integrated the methodologies into the 2002 Quality/Level of Service Handbook and Software • Refined the QLOS methodology with further reasearch • Conducted research on midblock crossing difficulty • Conducted research on pedestrian intersection crossing • Conducted research on Why People Cross Where They Do
Motivation - Literature • When to Cross • Observational • Modeling compliance to pedestrian signals at intersections • Where to Cross • Observational • No modeling studies • When and Where to Cross • No studies on the joint choices
Planning Question • How can existing intersection and midblock crossing planning tools be integrated to determine pedestrian LOS at the block level
Engineering Questions • How and when might a pedestrian go to a crosswalk at mid-block locations? • How and when might a pedestrian go to an intersection? • Where should bus stops be located so that riders are more likely to choose safe crossing options to access them?
Research Methodology Questions • What statistical models are most appropriate for modeling pedestrian street-crossing behavior? • What and how should data be collected in order to estimate such statistical models?
Answering the Questions • Developed a quasi-stated choice survey • Modeled the role of street environment in how pedestrians cross • Focus on the street environment so that variables are readily measured for models • Variables that transportation professionals can affect
Objective • Estimate nested logit models of the spatial aspect of pedestrian street crossing behavior
Pedestrian Environment Street Environment Trip characteristics Traffic conditions Roadway characteristics Control characteristics Institutional Environment Design standards and guidelines Pedestrian law Pedestrians’ knowledge of pedestrian law Policy Proposals Engineering Enforcement Education Motivation • Benefits • Reduced auto travel • More walking • More transit • Physically active • Reduced injuries
Observations - Crossing Behavior • Behavioral Choices • When • Where • Personal characteristics • Trip characteristics • Time constraints • Street environment • Traffic dynamics • Roadway characteristics
2000 1994 Deaths Crossing at mid-block 268 234 Crossing at intersection 55 71 Other reasons 283 223 Injuries Crossing at mid-block 2,905 2,678 Crossing at intersection 1,058 985 Other reasons 3,819 4,646 Pedestrian Safety Selected Florida statistics (1994 & 2000 Traffic Crash Facts)
Pedestrian Safety • Why do many choose unlawful options? • Is it education? • Is it law enforcement? • Are intersections safer? • Does crossing at intersections take longer? • Is crossing at intersections more reliable? • Is crossing at intersections more comfortable?
Presentation of Operational Conditions Behavioral Role of Participants None Staged Actual Paper & pencil Computer Simulation Video Field Survey Method • To collect the stated-preference data from a sample of the general public placed in real traffic conditions at a sample of street blocks without them actually crossing the streets. Stated Preference Revealed Preference
Logistics • 48 sites, representative of all public roads classified as collector or above • 86 participants • 4 survey days with variation by • Day of week • Hour of day (am peak, mid-day, pm peak) • On each survey day • 20 participants • 10 sites • 2 buses, each carrying 10 participants • Each bus visiting 6 sites • Each participant spending 5-6 hours
SURVEY DESIGN • Quasi-stated survey: • Identify potential determinants of pedestrian street-crossing behavior • Determine levels of key determinants through the selection of street blocks • Formulate crossing scenarios • Develop instruments for individuals • Differs from conventional stated-preference surveys
Crossing Options • Pre-defined • Maximum number of options is 5 for each site. • The exact number of options for a site is determined by the particular combination of start and end points. • A similar diagram would be shown on the survey form. • Observation would be stationary at the start point.
Crossing Options • Participant-defined • There are an infinite number of options.
Crosswalk Treatment • Desirable to include the presence of a mid-block crosswalk as one of the determinants. • Real • Rare in real life • Most on minor roads • No record of them • Temporarily delineated with • Tapes • Chalk • Cones
Pilot Test • Issues • Perceived adequacy of using three delineation approaches • Responses with pre- vs participant-defined options • Responses from stationary vs moving observation with participant-defined options • Perceived difficulty in understanding diagrams
Pilot Test • Tests • Two consecutive Tuesdays • Orange cones for both blocks on 1st day • Chalk for E block/tape for W block on 2nd day • Each participant provided preferences for both blocks on each day • Preferences were provided for 3 scenarios • Pre-defined options • Participants-defined options • Stationary observation • Allowed to walk roadside while observing • Additional questions after field surveys • Perceived adequacy of delineation methods • Perceived difficulty in understanding diagrams
Pilot Test • Difficulty of diagrams • Questions: • Did you have any difficulty in understanding the diagrams with pre-defined options? • Did you have any difficulty in understanding the other diagrams? • 1-5 scale with 5 being difficult and 1 no difficulty • 9 participated on 2nd day • Results: • Diagrams without pre-defined options: 1 for all • Diagrams with pre-defined options: 3 for one and 1 for everyone else
Field Design • Layout Survey Worker 3 Participants Nearside Traffic Counters Farside PSTA Survey Worker
Crossing Scenario • Street environment • Origin and destination of the crossing • Crossing options available
Site Clusters 1. USF 2. S Tampa 5. Clearwater 6. St Petersburg
Start and End Points Potential End Points Traffic Direction Intersection Intersection Traffic Direction Potential Start Points There are a total of 25 possible combinations. Each of the 48 sites can get a randomly selected combination.
Crossing Options • A = Crossing at the left intersection • B = Crossing at a mid-block start point at a right angle • C = Crossing with a jaywalk between the start and end points • D = Walking on the nearside to the opposite side of a mid-block end point and crossing there at a right angle • E = Crossing at the right intersection • F = Crossing at a mid-block crosswalk that is away from a start or end point Start
Crossing Mid-block Intersection Branches Individual Options C D F A E B Model Estimation Structure of Choice Set
Significant Variables and Characteristics • Continuous Variables • Roadside walking distance • Crossing Difference • Traffic Volume • Discrete Characteristics • Marked Crosswalks • Traffic Signals • Pedestrian Signals
Conclusions: Intersections • People more likely to cross at intersection with traffic or pedestrian signal • Most influential factors: • Pedestrian signals • Marked crosswalks • Traffic signals • Crossing at an intersection is highly responsive to increases in roadside walking distance. • 1% increase in distance reduces probability of that intersection being chosen by 1.5 -1.9% • Crossing distance has little influence on the decision to cross at an intersection
Conclusions: Mid-Block Crossing at mid-block is only marginally responsive to crossing distance, roadside walking distance and traffic volume. Of these, it is more responsive to roadside walking distance, followed by traffic volume and increases in crossing distance. Increases in crossing distance have the largest impact on jaywalking followed by intersection crossing and then mid-block crossing Increases in crossing distance are twice as likely to reduce jaywalking as increases in traffic volume Increases in crossing distance have greatest impact on jaywalking and least on mid-block
Conclusions: Mid-Block and Intersections • People are more likely to cross at a location if it has a marked crosswalk • Presence of a marked crosswalk is more influential at an intersection than mid-block • Increases in roadside walking distance impacts crossing at an intersection many times more than mid-block
Current Research • FDOT and CUTR are developing quantitative guidelines for placing midblock crosswalk by applying the Why People Cross Where They Do model and the Pedestrian Crossing Difficulty model.
More Information Martin Guttenplan, AICP martin.guttenplan@dot.state.fl.us Dr. Xuehao Chu xchu@cutr.usf.edu National Center for Transit Research at USF www.nctr.usf.edu/ Multimodal LOS resources can be found at: http://www.dot.state.fl.us/planning/systems/sm/los/default.htm