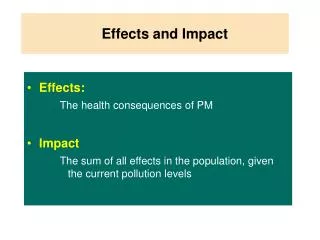
Effects and Impact
Effects and Impact. Effects: The health consequences of PM Impact The sum of all effects in the population, given the current pollution levels. Cambridge1.ppt. Studying Air Pollution Health Effects is a Research Challenge. Air pollution a complex mixture, not ONE substance

Effects and Impact
E N D
Presentation Transcript
Effects and Impact • Effects: • The health consequences of PM • Impact • The sum of all effects in the population, given the current pollution levels Cambridge1.ppt
Studying Air Pollution Health Effects is a Research Challenge • Air pollution • a complex mixture, not ONE substance • low concentrations • everybody is exposed • Health outcomes • Unspecific, no ‘air pollution disease’ • multi-causal, multi-pathway • EPIDEMIOLOGY Cambridge1.ppt
Investigating Air Pollution • With epidemiologic methods: difficult to assess effects of single pollutants! • We use single pollutants as indicators of the mixture • PM10 and finer particles: important health relevant indicator ! Cambridge1.ppt
Long-term effects of air pollution • Exposure over years or life-time • Effects occur late (after years) • Effects may be chronic • Requires mostly studies in very large populations, observed over years and decades ! Cambridge1.ppt
Typical Long-term effects of urban air pollution • Lower pulmonary function • Chronic respiratory symptoms increased • Lung cancer • Life expectancy decreased Cambridge1.ppt
Lung Cancer and Traffic related Air Pollution in Stockholm Nyberg et al. (Epidemiology 2000; 11:487-957) • All > 1’000 lung cancer cases, 1985-1990 • Residential exposure modeling for past 30 years • NO2 as a surrogate for carcinogens from traffic exhaust • Results: • Those with lung cancer had higher 10-yrs-exposure to traffic related air pollution • highest exposure group, 20-30 years ago: 40% higher risk for lung cancer (95%CI:0-100%) UN
Mortality (adjusted Relative Risk) and long-term mean pollution (PM2.5)Harvard Six-City Cohort Study, Dockery et al, NEJM 1993; 329 (24):1753-9 Relative Risk mean PM2.5 Cambridge1.ppt
Total Mortality: Smokers, Ex-smokers, and Air Pollution(Harvard Six City Cohort Study, Dockery et al, New Engl J Med 1993)
Short-term effects of Air Pollution Hospital admission Emergency visits Death counts, Pollution Time Period of exposure Time to event Period of events SHORT PERIODS Days or weeks SHORT PERIODS SHORT PERIODS SHORT PERIODS SHORT PERIODS Cambridge1.ppt
Typical short-term effects Death Hospital Emergency room Visit to the doctor Restricted activity Medication Symptoms Reduced lung function, Disturbance Number of susceptible people Cambridge1.ppt
Annual mean PM10 and expiratory capacity (FVC) in the 8 SAPALDIA areas Ackermann-Liebrich et al, AJRCCM 1997; 155 (1):122-129 FVC % deviation from predicted PM10 annual mean (g / m3) Cambridge1.ppt
The APHEA 2 Study in Europe Acute effects of particulate pollution on respiratory admissions (includes Milano and Roma) Atkinson RW et al; Am J Respir Crit Care Med 2001; 164 (10): 1860-66) % change per 10 g/m3 increase in PM10 (fixed effects single pollutant model) Asthma, age 0-14: +1.2% (0.2-2.3) Asthma, age 15-64: +1.1% (0.3-1.8) COPD + asthma, 65+ yr +1.0% (0.4-1.5) All respiratory, 65+ +0.9% (0.6-1.3) Cambridge1.ppt
The MISA Study – an italian example for short-term effects of air pollution Torino, Milano, Verona, Ravenna, Bologna, Firenze, Roma, Palermo Biggeri et al; Epidemiologia & Prevenzione 2001; 25(2) • % change (and 95th CI) per 10 g/m3 increase in PM10 • (random effects model) • Total daily mortality: +1.27% (0.62-1.92) • Hospital Admissions: • Cardiac diseases +1.15% (0.62-1.68) • Respiratory diseases +2.41% (1.72-3.11) Cambridge1.ppt
Outcome Cases Attribut. % Death (adults ³30 yrs.) 40‘600 (24‘600-56'900) ~ 6 % Hospital Admissions (cardio-respiratory causes) 48’000 (17’300–79’100) ~ 2 % Chronic Bronchitis(incidence in adults) 47'100 (4’300-93'500) ~ 12 % Bronchitis Episodes (children) 543'000 (239’500-981'600) ~ 30 % Restricted Activity Days(adults) 30.5 mill. (25.7-37.3 mill) ~ 12 % Asthma attacks Annual Cases (and %) attributed to Air Pollution Austria, France, and Switzerland (>50% are traffic related) 1.04 mill. (0.54–1.54 mill.) ~ 6 % Künzli et al, Lancet 2000; 356: 795-801 ambridge1.ppt
Impatto del PM10 in tre studi: 3 nazioni, Tirolo, 8 città italiane A/F/CH 24 g/m3 6 % 2% 12% 30% 12% 6% Concentrazione media Mortalità Ammissioni osp. (cardio-resp) Bronchite chronica Bronchite (bambini) Giorni con attività ridotta Attachi d‘asma 8 Città ~50 g/m3 2-8 % 2-4 % 2-22 % 18-33 % 13-16 % 8-9 % Südtirol 15-20 g/m3 3-5 % 1-2 % 7-11 % 17-28 % 6-11 % 3-5 % Conc. di riferimento 7.5 g/m3 30 g/m3 ambridge1.ppt
Effects of PM10 on daily respiratory admissions (age 65+) are stronger on days with high ozone Atkinson et al, APHEA 2 (Am J Respir Crit Care Med 2001; 164 (10): 1860-66) Cambridge1.ppt
Aumento percentuale della mortalità giornaliera (e limiti di confidenza al 95%) associato ad un aumento di 10μg/m3 nel livello di PM10 Dati dello studio Europeo APHEA Katsouyanni et al, Epidemiology 2001; 12 (5): 521-31 -1% 0% 1% 2% Cambridge1.ppt
Epidemiologic (hospital admiss. in children, pneumonia), toxicological and human broncho-alveolar effects of PM10 in the Utah Valley, with Steal mill on/off/on 120 PM10 100 Pneumonia Total cells (rat) Neutrophils in BAL Proteins in BAL IL-8 in BAL 80 % of 1986 60 40 20 0 Steal mill ON (1986) Steal mill OFF (1987) Steal mill ON (1988) Epidemiology: Pope et al, Arch Env Health, 1991;46: 90 Toxicology: Dye et al, Env Health Perspect, 2001; 109 (suppl 3):395 Human Experiment: Ghio & Devlin, Am J Respir Crit Care Med, 2001; 164:704 Cambridge1.ppt
Do these small effects matter ? Che cosa è l‘impatto di questi effetti piccoli? % increase (and 95% CI) per 10 g/m3 change in PM10 Mortality 4.3 % (2.6-6.1) Hospital admissions (cardio-resp.) 1.3 % (0.1-2.5) Chronic bronchitis (adults) 9.8 % (0.9-19.0) Bronchitis episodes (children) 30.6 % (13.5-50.2) Restricted activity days 9.4 % (7.9-10.9) Asthma attacks (children & adults) 4.0 % (1.9-6.2) Cambridge1.ppt
Inquinamento atmosfericoEffetti a breve termine sulla salute dell’uomo % increase (and 95% CI) per 10 g/m3 change in PM10 • Mortality 4.3 % (2.6-6.1) • Hospital admissions (cardio-resp.) 1.3 % (0.1-2.5) • Chronic bronchitis (adults) 9.8 % (0.9-19.0) • Bronchitis episodes (children) 30.6 % (13.5-50.2) • Restricted activity days 9.4 % (7.9-10.9) • Asthma attacks (children & adults) 4.0 % (1.9-6.2) Cambridge1.ppt
Air pollution related health costs (EUROs) per capita ~600 EUR per persona, all‘anno Sommer et al, OECD Report, 2000 Cambridge1.ppt
Inquinamento atmosfericoCosti correlati agli effetti sulla salute dell’uomo ~600 Euro per persona all‘anno (Sommer et al, OECD Report, 2000) Cambridge1.ppt
Conclusion • Air pollution has adverse effects on health • Evidence is strongest for short-term effects; long-term effects should be better investigated, in Europe • PM’s are an important aspect of air pollution, but other pollutants and the mixture may be relevant, too • The impact on public health is substantial, in Italy and Europe • Some ‘experimental evidence’ that improvements in air quality lead to health benefits very fastly (short-term effects) Cambridge1.ppt