Download
1 / 1
10 likes | 162 Vues
3.4.2. Comparison between Impact and Total Multiplier Effects on endogenous variables: Table 4 describes the level of endogenous variables under the five different assumptions. The coefficient estimates reflect the adjustment that would

E N D
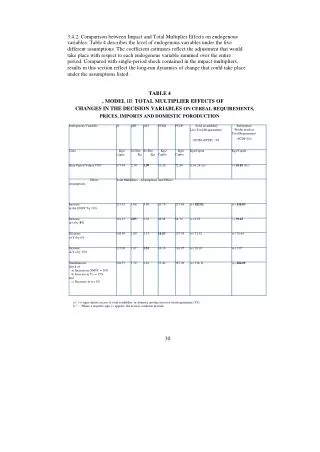
3.4.2. Comparison between Impact and Total Multiplier Effects on endogenous variables: Table 4 describes the level of endogenous variables under the five different assumptions. The coefficient estimates reflect the adjustment that would take place with respect to each endogenous variable summed over the entire period. Compared with single-period shock contained in the impact multipliers, results in this section reflect the long-run dynamics of change that could take place under the assumptions listed. TABLE 4 , MODEL III: TOTAL MULTIPLIER EFFECTS OF CHANGES IN THE DECISION VARIABLES ON CEREAL REQUIREMENTS, PRICES, IMPORTS AND DOMESTIC PORODUCTION a /: (+) signs denote excess of total availability or domestic production over total requirement (Y6) b /: Where a negative sign (-) appears, the reverse condition prevails. 30