Predicting Income from Census Data using Multiple Classifiers
Predicting Income from Census Data using Multiple Classifiers . Presented By: Arghya Kusum Das Arnab Ganguly Manohar Karki Saikat Basu Subhajit Sidhanta CSC 7333 PROJECT, SPRING’ 13 LOUISIANA STATE UNIVERSITY. Agenda. Objective Data Methods Artificial Neural Network

Predicting Income from Census Data using Multiple Classifiers
E N D
Presentation Transcript
Predicting Income from Census Data using Multiple Classifiers Presented By: ArghyaKusum Das ArnabGanguly ManoharKarki SaikatBasu SubhajitSidhanta CSC 7333 PROJECT, SPRING’ 13 LOUISIANA STATE UNIVERSITY
Agenda • Objective • Data • Methods • Artificial Neural Network • Normal Bayes Classifier • Decision Trees • Boosted Trees • Random Forest • Results • Comparisons • Observations CSC 7333 - Dr. Jianhua Chen
Objective • Analysis of Census Data to determine certain trends • Prediction task is to determine whether a person makes over 50K a year. • Analyze the accuracy and run time of different machine learning algorithms CSC 7333 - Dr. Jianhua Chen
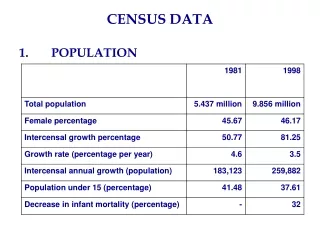
Data 48842 instances (train = 32561, test = 16281) 45222 if instances with unknown values are removed (train = 30162, test = 15060) Duplicate or conflicting instances : 6 2 classes : >50K, <=50K Probability for the label '>50K' : 23.93% / 24.78% (without unknowns) 14 attributes : both continuous and discreet-valued.
The Attributes Age Workclass fnlwgt Education Education-num Marital-status Occupation Relationship Race Sex Capital-gain Capital-loss Hours-per-week Native-country
Artificial Neural Network Sigmoid function is used as the squashing function. No. of Layers = 3 256 nodes in first layer. Second and third layers have 10 nodes each. Terminate if no. of epochs exceed 1000 or rate of change of network weights falls below 10-6. Learning rate = 0.1
Normal Bayes Classifier The classifier assumes that: Features are fairly independent in nature the attributes are normally distributed. It is not necessary for the attributes to be independent; but does yield better results if they are. Data distribution function is assumed to be a Gaussian mixture – one component per class. Training data Min vectors and co-variance matrices for every class Predict
Decision Trees • Regression tree partition continuous values • Maximum depth of tree = 25 • Minimum sample count = 5 • Maximum no. of categories = 15 • No. of cross validation folds = 15 • CART(Classification and Regression Tree) is used as the tree algorithmRules for splitting data at a node based on the value of variable Stopping rules for deciding on terminal nodes Prediction of target variable for terminal nodes CSC 7333 - Dr. Jianhua Chen
Boosted Trees Real AdaBoost algorithm has been used. Misclassified events Reweight them Build & optimize new tree with reweighted events Score each tree Use tree-scores as weights and average over all trees Weak classifier classifiers with error rate slightly better than random guessing. No. of weak classifiers used = 10 Trim rate Threshold to eliminate samples with boosting weight < 1 – trim rate. Trim rate used = 0.95
Random Forest Another Ensemble Learning Method Collection of tree predictors : forest At first, it grows many decision trees. To classify a new object from an input vector,: It is classified by each of the trees in the forest Mode of the classes is chosen. All the trees are trained with the same parameters but on different training sets
Random Forest (contd.) No. of variables randomly selected at node and used to find best split(s) = 4 Maximum no. of trees in the forest = 100 Forest accuracy = 0.01 Terminate if no. of iterations exceed 50 or error percentage exceeds 0.1
Results CSC 7333 - Dr. Jianhua Chen
Observations • Removing non relevant attributes improves accuracy (Curse of Dimensionality) • Some attributes seemed to have little relevance to salary. For example: Race, Sex. • Removing the attributes improves accuracy from by 0.21% in decision trees. • For Random Forest, accuracy improves by 0.33% • For Boosted Trees, accuracy falls slightly by 0.12% • For ANN, accuracy improves by 1.12% • Bayes Classifier – Removing co-related attributes improves accuracy. • Education-num highly related to Education. Removing education-num improves accuracy by 0.83% CSC 7333 - Dr. Jianhua Chen
Thank you!!! CSC 7333 - Dr. Jianhua Chen