Download
1 / 1
10 likes | 136 Vues
This project examines the use of genomic data from cancer tumors to accurately determine patient disease stages through gene expression analysis. By comparing two different ordering techniques, the Traveling Salesman Problem (TSP) and Probabilistic Ordering, we assess their effectiveness in predicting survival times. Initial results suggest similarities in ordering for small data subsets, yet notable discrepancies arise in larger groups. Future work will focus on refining the accuracy and precision of these ordering methods to enhance cancer prognosis models.

E N D
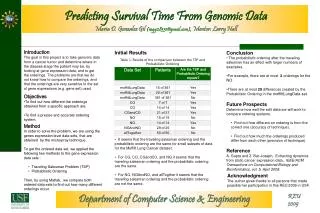
Predicting Survival Time From Genomic Data Maria D. Gonzalez Gil (mgg28331@gmail.com), Mentor: Larry Hall • Conclusion • The probabilistic ordering after the traveling salesman has an effect with larger numbers of examples. • For example, there are at most 2 orderings for the NO. • There are at most 29 differences created by the Probabilistic Ordering in the moffittLungData set. • Future Prospects • Determine how well the edit distance will work to compare ordering systems. • Find out how different an ordering is from the correct one (accuracy of technique). • Find out how much the orderings produced differ from each other (precision of technique). • Reference • A. Gupta and Z. Bar-Joseph, .Extracting dynamics from static cancer expression data,. IEEE/ACM Transactions on Computational Biology and Bioinformatics, vol. 5, April 2008. Introduction The goal in this project is to take genomic data from a cancer tumor and determine where in the disease stage the patient may be, by looking at gene expression data, and to get the orderings. The problems are that we do not know how to compare the orderings, and that the orderings are very sensitive to the set of gene expressions (e.g. gene set) used. Initial Results Table 1: Results of the comparison between the TSP and Probabilistic Ordering • Objectives • To find out how different the orderings obtained from a specific approach are. • To find a precise and accurate ordering system. • Method • In order to solve the problem, we are using the genes expression level data sets, that are obtained by the microarray technique. • To get the ordered data set, we applied the following two methods to the gene expression data sets : • Traveling Salesman Problem (TSP) • Probabilistic Ordering • Then, by using Matlab, we compare both ordered data sets to find out how many different orderings occur. • It seems that the traveling salesman ordering and the probabilistic ordering are the same for small subsets of data for the Moffitt Lung Cancer dataset. • For CG, CO, CGandCO, and NG it seems that the traveling salesman ordering and the probabilistic ordering are the same. • For NO, NGAndNO, and allTogther it seems that the traveling salesman ordering and the probabilistic ordering are not the same . Acknowledgment The author gives thanks to all persons that made possible her participation in this REU 2009 in USF. REU 2009 Department of Computer Science & Engineering