Download
1 / 42
420 likes | 526 Vues
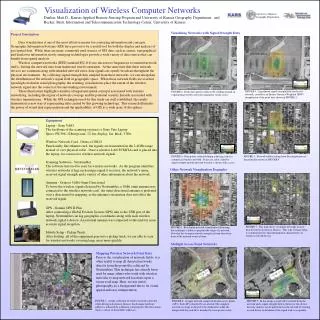
This presentation by Ryan Denniston at Duke University's Data Visualization Forum explores innovative methods for visualizing trade networks, focusing on the political economy of tobacco control in Southeast Asia. It covers the challenges of trade discrepancies, data visualization techniques using non-spatial (Excel) and spatial (ArcGIS) approaches, and the importance of effective communication for diverse audiences. Additionally, it emphasizes balancing data complexity with clarity to mitigate the impact of anomalies and ensure insightful analysis of bilateral trade flows.

E N D
Approaches to Visualization of Trade Networks Ryan Denniston Duke Data Visualization Friday Forum November 16, 2012
Outline • The nature of the problem(s) • Non-spatial approaches (Excel) • Spatial approaches (ArcGIS) • Sharing options
The Project Political economy of tobacco control in Southeast Asia • Southeast Asia increasingly wealthy, one of the few areas with low female prevalence
The Project Political Economy of tobacco control in Southeast Asia • Liberalized markets heighten importance of trade to health outcomes • Principal origins and destinations of cigarettes within and from outside the region • Especially large flows, indicative of transit points • Trade discrepancies, suggesting smuggling activity • Regional manufacturing hubs
The Project ASEAN Region – AFTA operational in 1996
The Nature of the Problem Provide a clear understanding of the underlying data • How important are the methods for the results? • Case selection (year, categories, etc.) Effective communication to applied audiences • Visible impact with minimal explanation • Compelling • Mitigation of data anomalies (missing data, etc.) Balance between comprehensiveness and complexity • At what point is the visualization overwhelming? • Who is the audience?
Project Data Data • Time series, cross sectional (annual) • Multiple levels of analysis • Typical sources: UN Comtrade, FAO Bilateral Trade Data
Non-Spatial Examples – Grouped Bars • Visualizes relative positions of cases • Year and case selection not apparent • Single variable, no groupings without data manipulation
Non-Spatial Examples – Stacked Column • Visualizes relative positions of cases • Year selection not apparent
Non-Spatial Examples – Line Charts • Limited case selection • Outliers and volatile data may cause problems
Non-Spatial Examples - Tradeoffs Problems • Data volatility when range of years displayed • Outliers distort when multiple cases displayed • Repeated cross-section (year selection) • Limited number of cases due to complexity • Others?
Spatial Examples – GIS Software ArcGIS essentially Excel with a column containing a shape (set of ordered coordinates) • Qgis is an alternate program • Recent tools launched to plot spatial data (addresses, lat/lon, some polygon sets, custom boundaries)
Spatial Examples Potential problems • Year-over year volatility • Threshold selection (across cases and over time) • Zero value, not available • Time series, ArcGIS does not sense minimum and maximum • Trade networks at different level of analysis Levels of analysis • Freeze one country, report its bilateral values over time • Find or create new layer at correct level of analysis
Spatial Examples – Bilateral Trade http://www.duke.edu/~rcd2/2.avi
Spatial Examples – Bilateral Trade http://www.duke.edu/~rcd2/4-incomplete.avi
Spatial Examples Problems • Volatility of data remains • Tradeoff between complexity and comprehensiveness • Threshold selection • Stability possible with grouping, data transformationhttp://www.duke.edu/~rcd2/Untitled.avi
Spatial Examples ArcScene is a 3D visualization and analysis program bundled with Map. Designed for x y z data, but can be coerced to multidimensional data. Mathematica, R, Matlab are other, likely better alternatives
Tableau 7 - Sharing http://public.tableausoftware.com/views/ag_nc/Sheet1
Tableau 7 – Custom Layers http://public.tableausoftware.com/views/autos_test_1/Sheet1?:embed=y
ArcGIS Online https://dukeuniv.maps.arcgis.com/explorer/?open=213f0e846ea84d03b198b9339645a936&extent=-8797614.54634536,4293258.24833525,-8771524.04069068,4306656.81009333 http://people.duke.edu/~rcd2/arcgis.html
ArcGIS Online – Multiple Layers and Types https://dukeuniv.maps.arcgis.com/explorer/?open=e43f3f5ef5b74d70b67ce9a9c49eef24&extent=-4388260.72929949,3794930.68242125,6008705.13322915,9285828.27856918
Google Fusion Tables https://www.google.com/fusiontables/DataSource?docid=1AwhNH8tuJE1DKDCS2XIXE7coEn97mnjdWKt9Z-Q
Google Fusion Tables https://www.google.com/fusiontables/DataSource?docid=1KGksrlD62Rbf0ZbymCMmQvnZohNwfhTFjiz64g
Links Vids 1. http://www.duke.edu/~rcd2/2.avi 2. http://www.duke.edu/~rcd2/4-incomplete.avi 3. http://www.duke.edu/~rcd2/Untitled.avi Sites 1. http://public.tableausoftware.com/views/ag_nc/Sheet1 2. http://public.tableausoftware.com/views/autos_test_1/Sheet1?:embed=y 3. https://dukeuniv.maps.arcgis.com/explorer/?open=213f0e846ea84d03b198b9339645a936&extent=-8797614.54634536,4293258.24833525,-8771524.04069068,4306656.81009333 4. https://dukeuniv.maps.arcgis.com/explorer/?open=e43f3f5ef5b74d70b67ce9a9c49eef24&extent=-4388260.72929949,3794930.68242125,6008705.13322915,9285828.27856918 5. http://people.duke.edu/~rcd2/arcgis.html 6. https://www.google.com/fusiontables/DataSource?docid=1KGksrlD62Rbf0ZbymCMmQvnZohNwfhTFjiz64g