Download
1 / 33
380 likes | 770 Vues
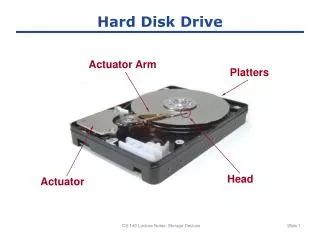
Finite Element Simulation of Operational and Non-operational Hard Disk Drive Response to Shock and Vibration. Eric Jayson Center for Magnetic Recording Research, University of California, San Diego. Outline. Introduction Modeling process Finite element models

E N D
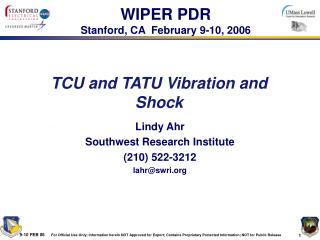
Finite Element Simulation of Operational and Non-operational Hard Disk Drive Response to Shock and Vibration Eric Jayson Center for Magnetic Recording Research, University of California, San Diego
Outline • Introduction • Modeling process • Finite element models • Experimental verification • Comparison of linear and tilt drop • Additional simulations • Operational drive simulation • Use of load curves for shock and vibration • L/UL suspension • Bump impact simulation • Summary
Introduction • Shock impulses are endured by a hard disk drive during manufacturing, shipping and user operation • Damage can occur to the magnetic material if the slider lifts off and recollides with the disk, i.e., head-slap • It is desirable to find a correlation between a linear drop test and a tilt drop test • Experimental data used to verify the numeric results, i.e., modal analysis and high speed video • Numeric simulations may be used to identify source of mechanical failure in variety of circumstances
Modeling with HyperMesh and LS-DYNA3D • LS-DYNA3D is an finite element solver used to analyze nonlinear dynamic problems • - large deformation dynamics & contact • - crash testing • - airbag deployment • - metal and plastic forming
Modeling with HyperMesh and LS-DYNA3D • HyperMesh is used as the pre- and post-processor • - import geometry model from Pro/E • - create mesh (elements and nodes) • - interface with LS_DYNA3D • - prepares input data cards • - analyze and display result files
Modeling with HyperMesh and LS-DYNA3D Pro/E or any CAD model for geometry Export lines and surfaces Import, mesh and define BC’s with Hypermesh Export input deck in LS-Dyna format Run input deck in LS-Dyna Import LS-Dyna results to Hypermesh Display results in Hypermesh
Contact modeled using a penalty method Linear springs placed normal to interface planewhere penetrating nodes are found Interface stiffness approximated with element stiffness in normal direction Algorithm: check if ‘slave’ nodes are penetrating ‘master’ surface apply force proportional to penetration distance calculate position of next time step and repeat Energy dissipated through friction Contact Algorithm
First HDD Finite Element Model • 3182 elements • 3135 nodes • No gimbal • Simplified geometry • Shell elements for suspension • Solids for rest • Complete impact surface modeled • Rigid connections do not allow rotational DOF
Head Slap Simulation for First HDD Model • Interference between slider and suspension • Pitch and roll motion apparent
Second HDD Finite Element Model • 7799 elements • 11735 nodes • Gimbal included • More complex geometry • Shells for suspension, gimbal and disk • Solids for rest • Impact surface reduced • Rigids allow all DOF
Head Slap simulation for Second HDD Model • Large deflection in the HGA • Oscillations in suspension cause collisions between the gimbal and suspension
Verification of Model: High Speed Video Analysis • Begins as slider is about to lift from disk surface • Large deflections observed in HGA • Significant pitch motion shown
Third HDD Finite Element Model • 8931 elements • 13025 nodes • Gimbal wire included • More complex geometry • Shells for suspension, gimbal and disk • Solids for rest • Modal analysis for this model
Verification of Model: Modal Analysis Mode Measured. Numeric arm bend 1050 1120 susp bend 3150 3210 susp torsion 7120 6940 arm 2nd bend 7250 7170 Arm 1st bending Suspension 1st bending Arm 2nd bending Suspension 1st torsion
Impact velocity is a function of drop height: Initial position h v Impact position Linear drop model
Displacement of slider corners (150mm drop) • Pitch and roll motion present • (a) and (b) show large pitch motion • (c) is strong impact of all four corners with the disk surface (d) • Smaller pitch and roll motion present in second head slap Slider (TEO) Slider (LEO) Slider (LEI) Slider (LEI) Disk surface
Displacement and acceleration data for slider corner (LEO) • Acceleration is related to impact force • Large spikes correspond to each contact • Smaller spikes caused by other corners of the slider impacting • Negative acceleration due to impacts between gimbal and suspension
Want to relate drop angle to impact angular velocity Conservation of energy used to find angular velocity: W r h Tilt drop model W = weight of HDD h = height of c.g. when dropped = drop angle = impact angular velocity r = radial distance to c.g.
Comparison of linear and tilt drop simulations • Correlation of a linear drop and a tilt drop is useful in predicting the response of the drive to shock • Reduce cost of testing in industry • Determine the worst case scenario for shock impulse • Comparison performed with same model but different BC’s
Duration for linear drop: (d) - (c) = 1.7ms Duration for tilt drop: (h) - (g) = 1.7ms Amplitude loss for linear: (a) to (b) = 82% loss Amplitude loss for tilt: (e) to (f) = 28% loss Slider displacement from disk surface Max slider displacement
Pitch and roll angle calculated from slider displacement data Pitch and roll of slider l = length of slider w = width of slider a,b,c,d = absolute displacement
Two tests have same vertical impact velocity at the head/disk interface Maximum linear drop head displacement is 1.91 mm Maximum tilt drop head displacement is 1.72 mm Pitch and roll displacement are more centered about 0 for linear drop test 68mm linear drop and 90deg tilt drop
Linear test shows 0.1 mm amplitude of motion Tilt test shows 0.15 mm amplitude of motion Lateral motion is centered about 0 line for linear test Lateral motion is centered about 0.05 line for tilt test Tilt drop test gives larger amplitude motion in both directions Lateral motion of head (cross track motion)
Operational HDD Shock Simulation • Airbearing modeled using linear springs for pitch, roll and z-direction stiffness • Z-dir stiffness = 208 N/mm • Roll stiffness = 6 N/mm • Pitch stiffness = 7 N/mm • Values determined from airbearing simulator for pico slider • Actuator rotated to operating position
Operational HDD Shock Simulation • Suspension, disk and actuator arm vibrations are present • Little displacement in slider, mostly lateral motion (cross track motion)
Load curves for shock simulation • Shock impulse is a half sine wave with an amplitude of 63 g’s and duration of 2 ms • Shock applied at actuator arm base and disk inner radius • Amplitude and duration easily varied • Results close to full HDD model
Load curves for vibration simulation • Prescribed translation in x,y and z direction • Vibration applied at actuator arm base and disk inner radius • Bandwidth and amplitude easily changed for particular model
L/UL Suspension Shock Simulation • Suspension in unloaded position subject to drop test corresponding to 50mm drop height • Hitachi suspension with slider and limiters • Large deflection apparent in HGA • Limiters very close to disengaging
Bump Impact Simulation • Modeled as operating drive running at 4200 rpm • Velocity of bump = 14730 mm/s • Height of bump (1 element) = 100 nm • Modeled constrained at actuator arm base and airbearing springs
Head slap is evident for non-operational shocks in both linear and tilt drop events Pitch and roll motion is present during head slap Contact force may be related to slider acceleration Energy dissipated quicker in linear model Duration and amplitude are similar for head slap in both linear and tilt drop models Summary and Conclusions
Pitch and roll motion slightly larger and more “one sided” for tilt drop test Lateral motion of slider is larger for the tilt drop simulation Experimental data verifies model Operational drive can be approximated using linear springs for pitch, roll and z-dir airbearing stiffness Summary and Conclusions
Operational drives show more lateral motion while non-operational drives show more vertical motion Load curves may be used to simulate shock events - similar results as drop test Load curves may also be used to simulate a HDD subject vibration loads Bump impacts excite modes of suspension and HGA Summary and Conclusions
We would like to acknowledge Seagate Technology for providing the opportunity to conduct this project Acknowledgements