Download
1 / 18
180 likes | 282 Vues
Explore the challenges of geological mapping in the Brabant Massif's Halle-Lembeek area with insights from Cambrian rocks lithostratigraphy. Discover how the magnetic properties of Tubize and Blanmont Formations aid in precise mapping. Unravel the structural complexities and consider the intriguing possibilities for this region.

E N D
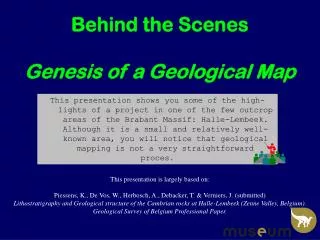
This presentation shows you some of the high-lights of a project in one of the few outcrop areas of the Brabant Massif: Halle-Lembeek. Although it is a small and relatively well-known area, you will notice that geological mapping is not a very straightforward proces. Behind the ScenesGenesis of a Geological Map This presentation is largely based on: Piessens, K., De Vos, W., Herbosch, A., Debacker, T. & Verniers, J. (submitted) Lithostratigraphy and Geological structure of the Cambrian rocks at Halle-Lembeek (Zenne Valley, Belgium). Geological Survey of Belgium Professional Paper.
The red square indicates the location of Halle-Lembeek within the Brabant Massif.
But during the construction of a railway track, several temporary outcrops were created.
This area was extensively drilled, providing even more information.
Two different units (formations) can be recognised. Green points show the occurence of the Tubize Formation.
? Clearly their distribution is not random. But where exactly is the contact between the two?
? In this particular situation, the properties of the rocks are helpfull.
? The Tubize Formation is often magnetic, the Blanmont Formation is non-magnetic.
This difference shows up on the aeromagnetic map. One square measures 100 by 100 meter.
As you can see, the green dots of the Tubize Formation correspond well to areas with higher aeromagnetic values, while the blue ones of the Blanmont Formation are located in or near aeromagnetic lows.
This allows to draw the boundary between the two formations more precisely. We now know the distribution of these two formations, but not yet the structure of the area.
1 Based on this information alone, you may postulate three different possibilities.
2 Based on this information alone, you may postulate three different possibilities.
3 Based on this information alone, you may postulate three different possibilities.
Also a detailed structural analysis could not reveal the true architecture of this area.
Conclusion: Three possibilities for this small area. A mapping of the complete Brabant Massif is even more challenging. And we can not afford to end up with more than one map. TO BE CONTINUED