Download

1 / 30
300 likes | 439 Vues
This study explores the accuracy of alignment in genomic sequences through simulations based on the Jukes-Cantor model. By analyzing insertions and deletions (indels) with a substitution/indel rate of 7.5, we investigate inter-gap distances using a neutral model and the Viterbi algorithm. The findings highlight biases in alignments, the significance of model accuracy, and how posterior probabilities can enhance alignment quality. We conclude that indel rates in human-mouse alignments are considerably higher than initially estimated, emphasizing the need for improved models.

E N D
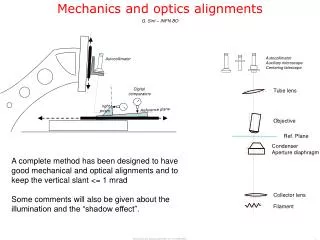
Indel rates and probabilistic alignments Gerton Lunter Budapest, June 2008
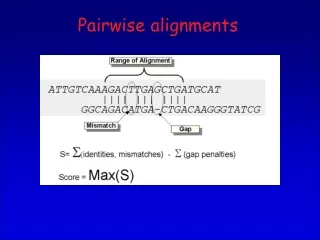
Alignment accuracy Simulation: Jukes-Cantor model Subs/indel rate = 7.5 Aligned with Viterbi + true model Observed FPF
Neutral model for indels CGACATTAA--ATAGGCATAGCAGGACCAGATACCAGATCAAAGGCTTCAGGCGCA CGACGTTAACGATTGGC---GCAGTATCAGATACCCGATCAAAG----CAGACGCA
Neutral model for indels Look at inter-gap segments Pr( length = L ) ? CGACATTAA--ATAGGCATAGCAGGACCAGATACCAGATCAAAGGCTTCAGGCGCA CGACGTTAACGATTGGC---GCAGTATCAGATACCCGATCAAAG----CAGACGCA
Neutral model for indels Look at inter-gap segments Pr( length = L ) ? Def: pi = Pr( columni+1survived | column isurvived) Assumption: indels are independent of each other CGACATTAA--ATAGGCATAGCAGGACCAGATACCAGATCAAAGGCTTCAGGCGCA CGACGTTAACGATTGGC---GCAGTATCAGATACCCGATCAAAG----CAGACGCA ii+1
Neutral model for indels Look at inter-gap segments Pr( length = L ) pi pi+1 ... pi+L-2 Def: pi = Pr( columni+1survived | column isurvived) Assumption: indels are independent of each other Assumption: indels occur uniformly across the genome CGACATTAA--ATAGGCATAGCAGGACCAGATACCAGATCAAAGGCTTCAGGCGCA CGACGTTAACGATTGGC---GCAGTATCAGATACCCGATCAAAG----CAGACGCA ii+1
Neutral model for indels Look at inter-gap segments Pr( length = L ) pL Def: pi = Pr( columni+1survived | column isurvived) Assumption: indels are independent of each other Assumption: indels occur uniformly across the genome Prediction: Inter-gap distances follow a geometric distribution CGACATTAA--ATAGGCATAGCAGGACCAGATACCAGATCAAAGGCTTCAGGCGCA CGACGTTAACGATTGGC---GCAGTATCAGATACCCGATCAAAG----CAGACGCA ii+1
Inter-gap distances in alignments + Log10 counts Transposable elements Weighted regression: R2 > 0.9995 Inter-gap distance (nucleotides)
Biases in alignments A: gap wander (Holmes & Durbin, JCB 5 1998) B,C: gap attraction D: gap annihilation
Influence of alignment parameters • De-tuning of parameters away from “truth” does not improve alignments • Accuracy of parameters (within ~ factor 2) does not hurt alignments much
Influence of model accuracy • Improved model (for mammalian genomic DNA): • Better modelling of indel length distribution • Substitution model & indel rates depend on local GC content • Additional variation in local substitution rate • Parameters: BlastZ alignments of human and mouse
Influence of model accuracy Simulation: • 20 GC categories • 10 substitution rate categories • 100 sequences each = 20.000 sequences • Each ~800 nt, + 2x100 flanking sequence
Summary so far • Alignments are biased • Accuracy depends on position relative to gap • Fewer gaps than indels • Alignments can be quite inaccurate • For 0.5 subs/site, 0.067 indels/site:accuracy = 65%, false positives = 15% • Choice of parameters does not matter much • Choice of MODEL does not matter much…
Alignments: Best scoring path (Needleman-Wunsch, Smith-Waterman, Viterbi) A T C A T C T G C A G T A C C G T T C A C A A T G G A T
Alignments: Posterior probabilities (Durbin, Eddy, Krogh, Mitchison 1998) A T C A T C T G C A G T A C C G T T C A C A A T G G A T
…leading to lower ‘asymptotic accuracy’… Posteriors & estimating indel rates …which cannot be observed – but posteriors can be… The inter-gap histogram slope estimates the indel rate, and is not affected by gap attraction… …and they are identical in the mean: .. but is influenced by gap annihilation…
Indel rate estimators Density: Alignment gaps per site Inter-gap: Slope of inter-gap histogram BW: Baum-Welch parameter estimate Prob: Inter-gap histogram with posterior probability correction
Human-mouse indel rate estimates Indel rate
Simulations: inferences are accurate Indel rate
Second summary • Alignments are biased, and have errors • Posterior accurately predicts local alignment quality • Posterior decoding improves alignments, reduces biases • With posterior decoding: modelling of indel lengths and sequence content improves alignments • Indel rates (human-mouse) 60-100% higher than apparent from alignments
Neutral indel model: Whole genome Transposable elements: Whole genome: Log10 counts Inter-gap distance (nucleotides) Inter-gap distance (nucleotides)
Estimating fraction of sequence under purifying selection Model: ● Genome is mixture of “conserved” and “neutral” sequence ●“Conserved” sequence accepts no indel mutations ● “Neutral” sequence accepts any indel mutation ● Indels are point events (no spatial extent) Account for “neutral overhang”: Correction depends on level of clustering of conserved sequence: Low clustering: conserved segment is flanked by neutral overhangneutral contribution = 2 x average neutral distance between indels High clustering: indels “sample” neutral sequenceneutral contribution = 1 x average neutral distance between indels Lower bound: ~79 Mb, or ~2.6 % Upper bound: ~100 Mb, or ~3.25 %
How much of our genome is under purifying selection? 2.56 – 3.25% indel-conserved (79-100 Mb) + : + Mb 5% Divergence (subs/site)
Inferences are not biased by divergence Simulation (100 Mb conserved) Inferred from data:
Conclusions • Alignment is an inference problem; don’t ignore the uncertainties! • Posterior decoding (heuristic) can be better than Viterbi (exact) • Indel rates are high. Useful for identifying functional regions,since indels can be more disruptive of function than substitutions. • Up to 10% of our genome may be functional, and a large proportion is rapidly turning over.