Download

1 / 31
330 likes | 541 Vues
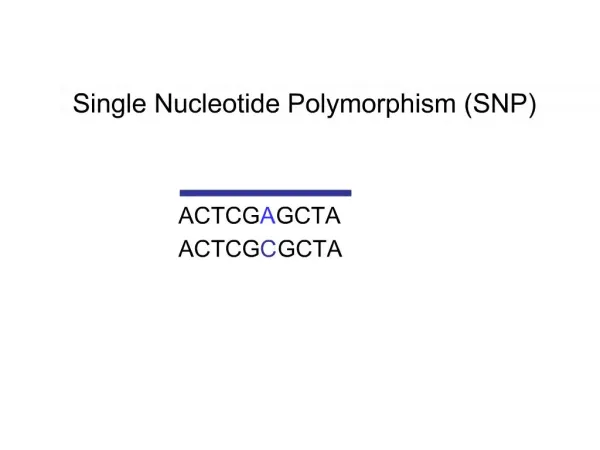
Single Nucleotide Polymorphism And Association Studies. Stat 115/215. International HapMap Project. The International HapMap project is a recent, large-scale effort to facilitate GWAS studies: Phase 1: 269 samples, 1.1 M SNPs Phase 2: 270 samples, 3.9 M SNPs

E N D
Single Nucleotide PolymorphismAnd Association Studies Stat 115/215
International HapMap Project • The International HapMap project is a recent, large-scale effort to facilitate GWAS studies: • Phase 1: 269 samples, 1.1 M SNPs • Phase 2: 270 samples, 3.9 M SNPs • Phase 3: 1115 samples, 1.6 M SNPs • Phase 3 platforms: • Illumina Human1M (by Wellcome Trust Sanger Institute) • Affymetrix SNP 6.0 (by Broad Institute)
Phase 1 & 2 • 90 Yoruba individuals (30 parent-parent-offspring trios) from Ibadan, Nigeria (YRI) • 90 individuals (30 trios) of European descent from Utah (CEU) • 45 Han Chinese individuals from Beijing (CHB) • 45 Japanese individuals from Tokyo (JPT)
Phase III samples • Population descriptors: • ASW (A): African ancestry in Southwest USA • CEU (C): Utah residents with Northern and Western European ancestry from the CEPH collection • CHB (H): Han Chinese in Beijing, China • CHD (D): Chinese in Metropolitan Denver, Colorado • GIH (G): Gujarati Indians in Houston, Texas • JPT (J): Japanese in Tokyo, Japan • LWK (L): Luhya in Webuye, Kenya • MEX (M): Mexican ancestry in Los Angeles, California • MKK (K): Maasai in Kinyawa, Kenya • TSI (T): Toscans in Italy • YRI (Y): Yoruba in Ibadan, Nigeria
Using 4242 independent SNPs and applying STRUCTURE CEU CHB CHD ç JPT LWK MEX MKK TSI YRI ASW
Non-African Populations GIH MEX
Haplotype Maps • Although there are around 10,000,000 SNPs, they group into a small number of groups of SNPs that are correlated with each other. • So, there are around around 300,000 unique arrangements of the SNPS • This is not that big of a number! • CS people can imagine an exhaustive search
SNP Characteristics:Linkage Disequilibrium • Hardy-Weinberg equilibrium • In a population with genotypes AA, aa, and Aa, if p = freq(A), q =freq(a), the frequency of AA, aa and Aa will be p2, q2, and 2pq, respectively at equilibrium. • Similarly with two loci, each two alleles Aa, Bb
SNP Characteristics:Linkage Disequilibrium • Equilibrium Disequilibrium • LD: If Alleles occur together more often than can be accounted for by chance, then indicate two alleles are physically close on the DNA • LD expected to decay monotonically on either side of each SNP • In mammals, LD is often lost at ~100 KB • In fly, LD often decays within a few hundred bases
Basic Concepts A B a b Parent 2 Parent 1 A B a b X a b A B A b A B a b OR A B a B A B A b a b A B a B A b A B a b A B etc… High LD -> No Recombination (r2 = 1) SNP1 “tags” SNP2 Low LD -> Recombination Many possibilities
SNP Characteristics:Linkage Disequilibrium • Three ways to calculate LD Observed Expected
SNP Characteristics:Linkage Disequilibrium • D’ = D / Dmax (Lewontin 1964) • D = 0.1, Dmax = 0.24, D’ = 0.1/0.24 = 0.427 • p1 = 0.6, q1 = 0.6
SNP Characteristics:Linkage Disequilibrium • Statistical Significance of LD • Chi-square test with 1 df • General chi-square tests • Permutation tests
SNP Characteristics:Linkage Disequilibrium • Can see haplotype block: a cluster of linked SNPs
A1A1, A2B2, A3A3 A1B1, B2B2, B3B3 A1A1, B2B2, A3B3 B1B1, B2B2, A3B3 A1B1, B2B2, A3B3 A1B1, B2B2, A3B3 A1 B2 A3 A1 B2 A3 A1 B2 B3 B1 B2 B3 B1 B2 B3 B1 B2 A3 or Haplotype: an illustration
SNP Characteristics:Linkage Disequilibrium • Haplotype boundary: blocks of sequence with strong LD within blocks and no LD between blocks • Haplotype size distribution
SNP Characteristics:Linkage Disequilibrium • [C/T] A T X C [A/C] [T/A] • Possible haplotype: 23 • In reality, a few common haplotypes explain 90% variations • Tagging SNPs: • SNPs that capture most variations in haplotypes • removes redundancy Redundant
SNP Characteristics:Population Stratification • Population Stratification: individuals selected from two genetically different populations in different proportions • Stratification may be environmental, cultural, or genetic • Could give spurious results in case control association studies (later this lecture)
SNP Discovery Methods • Where are the SNPs in human genome? • Sequence many individuals, find mismatches in alignments, too costly to sequence all • Computational: • Align genome assembly to EST (mRNA) for SNPs in the coding regions • Need to differentiate between SNP and sequencing error • Resequence to verify • dbSNP: 6 M SNPs
SNP Discovery Methods • Sequence-free SNP detection • First check whether big regions have SNPs • Basic idea: denature and re-anneal two samples, detect heterduplex • Can pool samples (e.g. 10 African with 10 Caucasians) to speed screening • Then sequence smaller regions to verify
SNP Genotyping • For a known locus TT C/A AG, does this individual have CC, AA or AC? • Use PCR to amply enough of the bigger region • Primer before SNP, then ddCTP and ddATP • Sequence a few bp: add A,C,G,T in turn, right nt incorporated to give light proportional # of incorporated nt • Use florescent probes (CTGAA): give out light if hybridized 3’- GACTT -5’ • SNP chip (simultaneously genotype thousands of SNPs) CC AA CA
Association Studies • Association between genetic markers and phenotype • Especially, find disease genes, SNP / haplotype markers, for susceptibility prediction and diagnosis • Two strategies: • Population-based case-control association studies • Family-based association studies
Case-Control Association Studies • SNP/haplotype marker frequency in sample of affected cases compared to that in age /sex /population-matched sample of unaffected controls • Expected: • (24 + 278) * (24 + 86) / (24 + 278 + 86 + 296) = 49 • (278+296) * (86+296) / (24 + 278 + 86 + 296) = 321 • 2 = 27.5, 1df, p < 0.001
Pitfalls of Association Studies • Association causal • Difficult when several genes affecting a quantitative trait • Penetrance (fraction of people with the marker who show the trait) and expressivity (severity of the effect) • Population stratification • e.g. some SNP unique to ethnic group • Need to make sure sample groups match • Hidden environmental structure • Not very reproducible
Family-based Association Studies (TDT) • Look at allele transmission in unrelated families and one affected child in each • Could also compare allele frequency between affected vs unaffected children in the same family Like coin toss
Reproducibility of Association Studies • Most reported associations have not been consistently reproduced • Hirschhorn et al, Genetics in Medicine, 2002, review of association studies • 603 associations of polymorphisms and disease • 166 studied in at least three populations • Only 6 seen in > 75% studies
Cause for Inconsistency • What explains the lack of reproducibility? • False positives • Multiple hypothesis testing • Ethnic admixture/Stratification • False negatives • Lack of power for weak effects • Population differences • Variable LD with causal SNP • Population-specific modifiers
Causes for Inconsistency • A sizable fraction (but less than half) of reported associations are likely correct • Genetic effects are generally modest • Beware the winner’s curse (auction theory) • In association studies, first positive report is equivalent to the winning bid • Large study sizes are needed to detect these reliably
Should we Believe Association Study Results? • Initial skepticism is warranted • Replication, especially with low p values, is encouraging • Large sample sizes are crucial • E.g. PPARg Pro12Ala & Diabetes
Acknowledgement • Tim Niu • Kenneth Kidd, Judith Kidd and Glenys Thomson • Joel Hirschhorn • Greg Gibson & Spencer Muse