Download
1 / 33
330 likes | 359 Vues
Learn about the essentials of measurements including accuracy, precision, and significant digits. Discover how to make precise estimates, choose the right measuring instruments, and understand the SI units system for accurate communication.

E N D
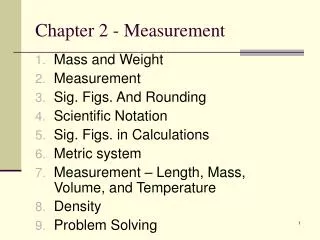
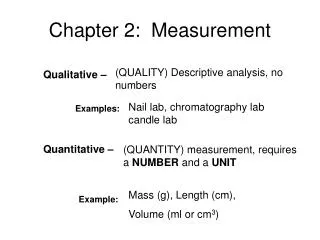
Section 1Description and Measurement • Every day we make observations. Sometimes those observations require that we take measurements of things. • Observations can be inaccurate. • Making measurements removes much of the doubt about an observation.
Measurement describes the world using numbers. -Types of measurements might include distance, time, speed, volume, and mass. -Measurements can also help to describe events.
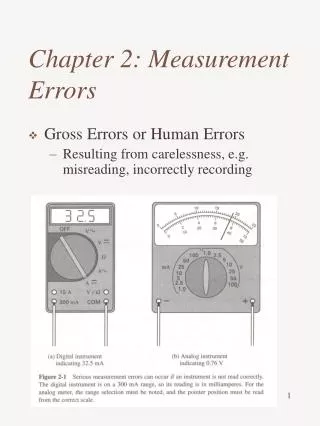
However, you must choose the proper instrument when you measure something. You must consider what it measures and how precise it is. For example: What instrument would you use to determine the winner at a swim meet? _________ How precise should that instrument be?
Description and Measurement • Some measurements can be exact, but others are too difficult to measure exactly. In those cases we make approximate measurements. • When do you think you should make an approximate measurement? • On what do you base that measurement?
Approximated measurement based on previous experience is estimation. • Estimation is useful when actual measurements are not easily made. • Estimation can check that an answer is reasonable. • When you estimate, you often use the word about.
Description and Measurement • Precision and Accuracy • Precision - a description of how close measurements are to each other. • Used to discuss a number of decimal places a measuring device can measure. • Degrees of Precision – today’s measuring devices are more precise.
Accuracy – a comparison of a measurement to the actual value. • Precision and accuracy are important in many medical procedures. • Measurements can be rounded when precision is not needed.
When should you not estimate a value? • Look at the photo in Figure 3 on page 40 of your textbook. Estimate the height of the tree. • Using Figure 4 on page 41 of your textbook, which of the three timepieces would you use to be sure to make it to school on time?
What is the difference between precision and accuracy? • If you don’t have the measuring instrument in front of you to determine its precision, how can you tell which numbers in the measurement are important?
Significant digits – reflect the true precison of a calculation or measurement. • Rules for determining significant digits: • All non-zero digits are significant. • Any zero between non-zero digits are significant. • Any zero to the right of the decimal point AND to the right of a non-zero digit is significant.
How many significant digits are in each of the following numbers? • 53.27 5. 20.009 • 600 6. 93.10 • 0.0123 7. 100.01 • 804 8. 54.0020
Answers should always be recorded in a specific number of significant digits. • In multiplication or division the measurement with the fewest significant digits determines the number of significant digits in the answer. Example: 23.056 x 21 = 484.176, but following the above rule, the answer becomes 480.
In addition or subtraction the number of significant digits in the answer is determined to the place value of the least precise measurement. Example: 23.7 + 34.65 + 83.041 = 141.391 but following the above rule, the a answer becomes 141.4
Section 2 – SI Units • A common system of measurement is very important. • In ancient times measurements were based upon the physical characteristics of the pharaoh. Why would this system of measurement be a problem?
We need to be able to accurately communicate measurements for science, business, and industry. • The system that is used for this accurate communication is the International System. This system, SI, has units based upon multiples of ten. • These units are very specific units of another system called the metric system. (Look at Table 1 on page 46 of your textbooks.)
The metric system is a measuring system based on multiples of ten. • It uses a set of pre-fixes based on multiples of ten to change the meaning of the measurement. (Look at Table 2 on page 46 of your textbooks.)
Measuring Length • Length is the distance between two points. In SI units it is measured in meters. • One meter is about the length of a baseball bat or slightly longer than a yard.
Not every length measurement should be made in meters. The length of your pencil might be better measured in centimeters. • The distance from New York to Chicago would be measured in kilometers.
Measuring Volume • Volume is the amount of space an object takes up. In SI units, volume is measured in cubic meters. • Just as with length, you must choose the most appropriate measurement for the object you are measuring. You would not use cubic meters to determine the volume of tea cup. How many cubic centimeters are in a cubic meter?
To find the volume of a regular shape – measure the length, width, and height of the object then multiply those measurements together. • For example: To find the volume of a wooden block, you would have to measure its length (25 cm), its width (32 cm), and its height (15 cm).
The volume is then determined by multiplying those three measurements: 25 cm x 32 cm x 15 cm = 12,000 cm3
To find the volume of an irregularly shaped object you must use a method other than directly measuring the sides of the object. The method to use in this situation is volume by immersion. This means you will place the object in a liquid (such as water) and determine how much water it displaces. That will be its volume!
Mass • The amount of matter in an object is its mass. • In SI units, mass is measured in kilograms. • Weight is a measurement of force. • In SI units, weight is measured in newtons.
Weight and mass do not measure the same thing! Mass measures how much “stuff” (matter) is in an object and will not change unless we take away or add to the object. Suppose you travel to the moon. Will your mass change?
Weight is determined by the pull of gravity. Your weight might change if the pull of gravity changes. On the moon, will you weigh more, less, or the same as on Earth?
Temperature is a measure of the kinetic energy in the particles of matter. The SI unit of temperature is the kelvin. Time is the interval between two events. The SI unit of time is the second.
Rate is the amount of change of one measurement in a given amount of time. Rate can be measured in units of m/sec, baseballs/minute, gallons/hour, hamburgers served/hour, etc.
Section 3Drawings, Tables, and Graphs • Scientific illustrations often make information more clear than written text can. Drawings can emphasize only necessary details or show things you can’t see. Photographs show an object exactly as it is at a single moment.
Tables display information in rows and columns for easier comprehension.
Line graphsshows the relationship between variables, which must be numbers. • Bar graphsuse bars of different sizes to show relationships between variables; one variable is divided into parts; the other variable is a number. • Circle graphsshow parts of a whole as percentages. • Scaleson graphs must be carefully constructed and analyzed so users easily understand the information. • Graphs collect, organize, and summarize data visually.
Don’t forget: • Measuring is a very important part of science – it is exact and leaves no doubt in a quantity. • In order to communicate properly, people must use a common system of measurement. • We use drawings, tables, and graphs to communicate our ideas in forms that make the data easier to understand.
Chapter 2Measurement The End