Download
1 / 32
320 likes | 436 Vues
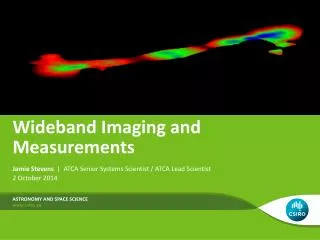
Wideband Imaging and Measurements. Astronomy and space science. Jamie Stevens | ATCA Senior Systems Scientist / ATCA Lead Scientist. 2 October 2014. Outline. Why are wide bandwidths useful? How are wide bandwidth images made? How do we make accurate measurements from wide bands?

E N D
Wideband Imaging and Measurements Astronomy and space science Jamie Stevens | ATCA Senior Systems Scientist / ATCA Lead Scientist 2 October 2014
Outline • Why are wide bandwidths useful? • How are wide bandwidth images made? • How do we make accurate measurements from wide bands? • What problems might we have with wide bandwidths? Wideband Imaging and Measurements | Jamie Stevens | Page 2
Wide Bandwidths • For continuum mapping, the more bandwidth you get, the lower the thermal noise level can be. • In this equation for RMS noise, the bandwidth enters as , so as the bandwidth gets larger, the noise gets smaller. Wideband Imaging and Measurements | Jamie Stevens | Page 3
Not only advantageous for continuum! • Spectral-line observations can also benefit from an increase in bandwidth. • Although a line is the same width regardless of the receiver bandwidth, having larger bandwidths available allows you to: • more quickly search frequency-space for line emission at an unknown velocity • observe more than one line simultaneously • better estimate the bandpass in the emission-free bandwidth, and thus more accurately measure the line emission Wideband Imaging and Measurements | Jamie Stevens | Page 4
Divide and Conquer • Wide bandwidths cause issues. • Simplest solution: split up your bandwidth, and make several smaller-bandwidth images, do your measurements on each separately, or stack the images together. • This is sometimes the only solution (think Ryan’s frequency-changing polarisation that averages to 0), but often this approach does not let you get everything you can from your data. Wideband Imaging and Measurements | Jamie Stevens | Page 5
Imaging Wideband Continuum • The imaging process for wideband continuum images is call multi-frequency synthesis. • In our most popular CABB mode, the 2048 MHz of bandwidth is split into 2048 channels, each channel being 1 MHz wide. Each channel is individually gridded to make a single image covering the entire band. • This can have benefits not only for sensitivity but for uv-coverage as well. Wideband Imaging and Measurements | Jamie Stevens | Page 6
6 km array, 128 MHz bandwidth (old ATCA correlator) 6km array, 2048 MHz bandwidth (CABB correlator) uv coverage improvement Wideband Imaging and Measurements | Jamie Stevens | Page 7
Multi-frequency synthesis • The observing bandwidth is split into channels, and each channel’s real and imaginary components are placed on a uv grid, and the entire thing is Fourier transformed to make the image. • Very easy in principle! But in reality we have a couple of complicating factors. Wideband Imaging and Measurements | Jamie Stevens | Page 8
Fractional Bandwidth • The information contained in a single channel is the average of all the frequencies that channel covers. • Larger channels and bandwidths make the observation more sensitive, but we also have to be aware of the “fractional bandwidth” that each channel represents. • where is the bandwidth (either of the channel or band), • and is the observing centre frequency Wideband Imaging and Measurements | Jamie Stevens | Page 9
Fractional Bandwidth • For the ATCA with CABB, we have a bandwidth of 2048 MHz. • In the 16cm band, which is centred at 2100 MHz, the fractional bandwidth we can observe is ≈ 1. The lowest frequency we routinely observe is 1076 MHz. • Using 1 MHz channels, the fractional channel bandwidth at the lowest frequency is 0.09%. Using 64 MHz, it is 6%. • Such a large fractional channel bandwidth can cause “bandwidth smearing”. Wideband Imaging and Measurements | Jamie Stevens | Page 10
Bandwidth Smearing • The response to a point source that has coordinates on the sky will be radially elongated towards the phase centre by: • Consider a 6km array at 2100 MHz; it has a resolution of 2.5 arcseconds. • A 64 MHz channel would smear twice that amount at • = 164 arcseconds. That’s only halfway to the half-power point of the primary beam! Wideband Imaging and Measurements | Jamie Stevens | Page 11
Bandwidth Smearing 2048 x 1 MHz channels Wideband Imaging and Measurements | Jamie Stevens | Page 12
Bandwidth Smearing 32 x 64 MHz channels Wideband Imaging and Measurements | Jamie Stevens | Page 13
Bandwidth Smearing 32 x 64 MHz channels Primary Beams 3.1 GHz 2.1 GHz 1.1 GHz Wideband Imaging and Measurements | Jamie Stevens | Page 14
Bandwidth Smearing This is why we don’t let observers use the 64 MHz mode for low-frequency continuum observations Wideband Imaging and Measurements | Jamie Stevens | Page 15
Spectral Index • The flux density of a source is not generally the same at all frequencies. It will usually vary smoothly however, and can in most cases be described by: • is the spectral index. In this lecture, our convention is that if the spectral index is negative, the flux density of the source decreases with increasing frequency. Commonly, is in GHz, and: • Steep spectrum = α < -0.5 • Inverted spectrum = α> 0.5 • Flat spectrum = -0.5 < α < 0.5 Wideband Imaging and Measurements | Jamie Stevens | Page 16
Calibration of Spectral Index • It is very important to ensure that you account for spectral index during calibration. • Ideally, the bandpass calibration can be performed with a source that has a known flux density model, such as 1934-638. This is not always possible though, since many very strong sources are quite variable. • Correction of the bandpass response function can be done later if required though, as it is usually just a slope adjustment. Wideband Imaging and Measurements | Jamie Stevens | Page 17
Incorrect Bandpass Correct Bandpass Bandpass Correction Wideband Imaging and Measurements | Jamie Stevens | Page 18
Measuring Flux Density For a bright source at the phase centre, it is easy to do a linear fit for flux density as a function of frequency. This is how all flux density measurements are made in the ATCA Calibrator Database. OR Jy Jy Wideband Imaging and Measurements | Jamie Stevens | Page 19
Measuring Flux Density If you need to image the field to get the flux density, you might get a different answer though. The same calibrator that we just measured via spectral fit has an image-measured flux density that is higher. This is because the spectral index hasn’t been taken into account. Jy (1.6% higher) Jy (1.2% higher) Wideband Imaging and Measurements | Jamie Stevens | Page 20
Correcting Image Flux Density • The band-averaged flux density of a source could be considered as the weighted mean of all the channels going in to the image. • But we know that • So, substituting, rearranging and simplifying to equal weights: Wideband Imaging and Measurements | Jamie Stevens | Page 21
Correcting Image Flux Density • We can further rearrange to recover the flux density at the reference frequency: • Measure the spectral indices from the images: 9.0 GHz 5.5 GHz α = -1.094 α = -1.068 Wideband Imaging and Measurements | Jamie Stevens | Page 22
Correcting Image Flux Density A substantial improvement in accuracy is achieved in this way. Note that this only applies to linear spectral index with no curvature, and that the correction has to be done manually (Wolfram Alpha is your friend). It is left as an exercise for the reader to deal with higher order α terms: Miriad cannot make images with higher order spectral index terms, but CASA can. Wideband Imaging and Measurements | Jamie Stevens | Page 23
Average Frequency Calculation • Our correction equation is actually calculating the frequency that we are measuring at. • Obviously, is actually . Now compare with: • Identifying the correspondence and rearranging gives us the average frequency as: Wideband Imaging and Measurements | Jamie Stevens | Page 24
Correcting Spectral Index • Spectral index is dependent on the distance from the beam centre. ATCA 16cm beam 1524 MHz 2164 MHz 2932 MHz Response at the beam centre is frequency independent. Wideband Imaging and Measurements | Jamie Stevens | Page 25
Correcting Spectral Index • Spectral index is dependent on the distance from the beam centre. ATCA 16cm beam 1524 MHz 2164 MHz 2932 MHz Response goes down with increasing frequency, which has the effect of steepening the spectral index. Wideband Imaging and Measurements | Jamie Stevens | Page 26
Spectral Index Correction Wideband Imaging and Measurements | Jamie Stevens | Page 27
Spectral Index Correction Not PB corrected Wideband Imaging and Measurements | Jamie Stevens | Page 28
Spectral Index Correction PB corrected Wideband Imaging and Measurements | Jamie Stevens | Page 29
Spectral Index Correction PB corrected uncorrected corrected Wideband Imaging and Measurements | Jamie Stevens | Page 30
Summary • When imaging with wide bandwidths Wideband Imaging and Measurements | Jamie Stevens | Page 31
Thank you • Astronomy and Space Science Jamie StevensATCA Senior Systems Scientist t +61 2 6790 4064 e jamie.stevens@csiro.au w www.narrabri.atnf.csiro.au Astronomy and space science