Download

1 / 71
710 likes | 723 Vues
This workshop provides an overview of the state accountability system for schools and districts in Waller ISD. Learn about the 2015 accountability ratings and performance indices.

E N D
State Accountability Overview Kelly Baehren Waller ISD Administrative Workshop July 28, 2015
Communicate with others as clearly as you can to avoid misunderstandings. Don Miguel Ruiz
2015 Accountability There is a time to let things happen and a time to make things happen. Hugh Parker
2015 Accountability Rating System http://ritter.tea.state.tx.us/perfreport/account/2015/index.html
Performance Index Criteria2015 Rating Labels • Met Standard:Met performance index targets on all indexes for which they have performance data in 2015. • Improvement Required: Did not meet one or more performance index targets.
2015 Ratings Criteria To receive a Met Standard Rating all campuses and districts must meet the following accountability targets for: Index 1 OR Index 2 AND Index 3 AND Index 4
2015 Accountability Snapshot The following snapshot table applies for accountability purposes: 10-25-13 10-31-14
Level II Satisfactory Phase-in 1 2015 = Final Year (1.0 SD below Final Standard)
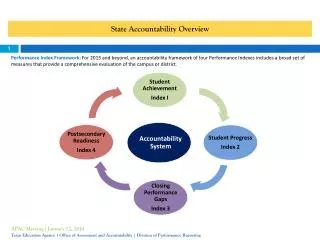
Index 1: Student Achievement Snapshot of performance across subjects, on both general and alternative assessments, at the satisfactory performance standard (Phase-in I Level II for 2015). • Subjects: Combined over Reading/ELA, Mathematics (Algebra I only), Writing, Science and Social Studies. • Student Groups: All Students only
Index 1: Student Achievement Performance Standards: Phase-in I Level II (Satisfactory), meets or exceeds the ELL Progress Measure, or meets equivalency standard on Substitute Assessment • STAAR Grades 3-8 English and Spanish (3-5) Spring 2015 (STAAR & STAAR L) • EOC Assessments (best results: highest score) Spring 2015, Fall 2014, and Summer July 2014 (STAAR& STAAR L)
Index 2: Student Progress Measures student progress by subject and provides opportunity to receive credit for improving student performance independent of overall student achievement. • Subjects: Reading, Writing (NEW) and Mathematics (Algebra I only) • Ten Student Groups Evaluated: • All Students • Students served by Special Education • English Language Learners (ELL) – Progress measure is used • Seven Racial/Ethnic Groups: African American, American Indian, Asian, Hispanic, Pacific Islander, White, and Two or More Races
Index 2: Student Progress Three Progress Indicators: • Did Not Meet Growth Progress • Met Growth Progress • Exceeded Growth Progress Points for progress in each subject are weighted: • One point credit for each percentage of tests that Met or Exceeded progress • One additional point for each percentage of tests that Exceeded progress
Index 3: Closing Performance Gaps Emphasizes theacademic achievement of economically disadvantaged students and the two lowest performing race/ethnicity students groups. • Subject Area: Reading, Mathematics (Algebra I only), Writing, Science and Social Studies • Student Groups: • Economically Disadvantaged • Lowest Performing Race/Ethnicity: Two lowest performing race/ethnicity student groups on the campus or district (based on 2014 assessment results)
Index 3: Closing Performance Gaps Points based on weighted performance: • One point for each percentage of tests meeting the phase-in satisfactory performance standard or above on the STAAR assessment • One additional pointis given for each percentage of tests meeting the advanced performance standard on the STAAR assessment.
Index 4: Postsecondary Readiness Emphasizes the role of elementary and middle schools in preparing students for the rigors of high school, and the importance of earning a high school diploma that provides students with the foundation necessary for success in college, the workforce, job training, or the military.
Index 4: Postsecondary Readiness ***Elementary & middle schools report only on STAAR results***
Index 4: Postsecondary Readiness STAAR Postsecondary Readiness Standard: • Percentage of students with STAAR test results at or above the final Level II performance standard on two or more subject area tests. • 8 Student Groups: All & 7 Racial/Ethnic Groups
Index 4: Postsecondary Readiness Graduation Rate Score: • Reflects the highest number of points possible from the combined performance across graduation rates for grades 9-12 (4-yr or 5-yr Grad Rate – Class of 2014 or Class of 2013) • 10 Student Groups: All, SPED, ELL & 7 Racial/Ethnic Groups
Index 4: Postsecondary Readiness Graduation Plan Score: • Based on an a longitudinal cohort of students graduating under the Recommended High School Program or Distinguished Achievement Program (RHSP/DAP). (Class of 2014) • 8 Student Groups: All & 7 Racial/Ethnic Groups
Index 4: Postsecondary Readiness Postsecondary Component: College and Career Readiness • College-ready graduate meeting or exceeding the Texas Success Initiative (TSI) criteria in both reading/English language arts(ELA) and mathematics on the TAKS Exit-level test, SAT, or ACT Test. (Class of 2014) • Completed and earned credit in at least two advanced/dual credit enrollment courses • Enrolled in a CTE-Coherent Sequence of Courses • 8 Student Groups: All and 7 Racial/Ethnic Groups
System Safeguards 2015
System Safeguards • With the performance index framework, poor performance in one subject or one student group does not result in an Improvement Required Rating. • System safeguards are added to ensure that poor performance in one area or one student group is not masked in the performance index. • Texas Accountability Intervention System (TAIS) – District & Campus Leadership Teams & DIP/CIP Documentation
NCLB Waiver from USDE Submitted again
Distinction Designations • Academic Achievement in Reading/ELA (campus only) • Academic Achievement in Mathematics (campus only) • Academic Achievement in Science (campus only) • Academic Achievement in Social Studies(campus only) • Top 25 Percent: Student Progress (campus only) • Top 25 Percent: Closing Performance Gaps(campus only) • Postsecondary Readiness (campus and district)
Distinction Designation Labels • Distinction Earned • No Distinction Earned • Not Eligible ***All distinction designations for campuses are based on performance in the top quartile (Q1) of its comparison group***
Campus Comparison Groups Grouped with 40 other schools that are similar: campus size, grade levels, % Low SES, mobility rate, and % ELL Q1 = Top 10 “Each campus is assigned to a unique comparison group of Texas schools that are most similar to it” Released June 2015
Academic Achievement in Reading/ELA HS = Must be in top quartile for 33% or more of their indicators JH & ELEM = Must be in top quartile for 50% or more of their indicators
Academic Achievement in Mathematics ***Exclusion of 3-8 math HS = Must be in top quartile for 33% or more of their indicators JH & ELEM = Must be in top quartile for 50% or more of their indicators
Academic Achievement in Science HS = Must be in top quartile for 33% or more of their indicators JH & ELEM = Must be in top quartile for 50% or more of their indicators