State Accountability Results
130 likes | 398 Vues
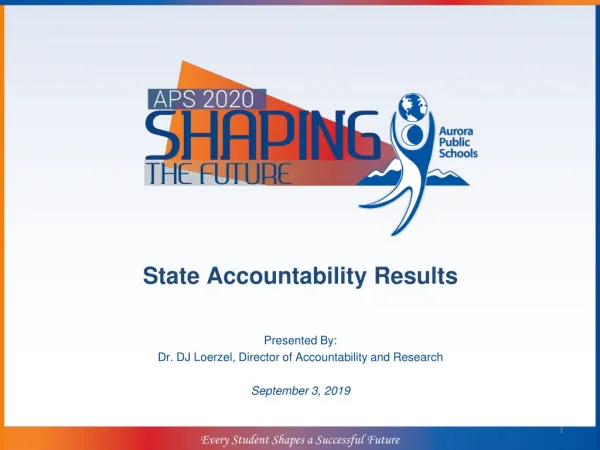
State Accountability Results. Presented By: Dr. DJ Loerzel, Director of Accountability and Research September 3, 2019. Every Student Shapes a Successful Future. State Accountability. Why is this topic on the board agenda?

State Accountability Results
E N D
Presentation Transcript
State Accountability Results Presented By: Dr. DJ Loerzel, Director of Accountability and Research September 3, 2019 Every Student Shapes a Successful Future
State Accountability • Why is this topic on the board agenda? • To provide an overview of the District (DPF) and School (SPF)Performance Frameworks • What are we asking the board to do with this information? • Understand the key data points utilized by the State and how it represents district performance • How is this linked to the Strategic Plan vision, mission, goals & core beliefs? • State Accountability is essential to APS’ mission and vision that Every Student Shapes a Successful Future Every Student Shapes a Successful Future
State Accountability Process • Background • Point Distribution • Key Performance Indicators • Accreditation • Plan Types • Additional Descriptors • District Performance Every Student Shapes a Successful Future
Accountability Background The District (DPF) and Schools (SPF) Performance Frameworks seek to: • hold districts/schools accountable for performance on the same, single set of indicators and measures • inform a differentiated approach to state support based on performance and need, by specifically identifying the lowest performing schools and districts These goals are part of the Colorado Department of Education’s (CDE) Statewide System of Accountability and Support and the goals outlined in the Education Accountability Act of 2009 (SB 09-163) Every Student Shapes a Successful Future
DPF/SPF Structures Frameworks include three measures of student success: • Academic Achievement • Academic Longitudinal Growth • Postsecondary and Workforce Readiness Points are earned for overall student and disaggregated groups: • Previously Identified on a READ Plan • English Language Learners • Free/Reduced Lunch Eligible • Minority Students • Students with Disabilities Every Student Shapes a Successful Future
Point Distributions • District/High School • Achievement – 30% • Growth – 40% • PWR – 30% • ES/MS • Achievement – 40% • Growth – 60% Every Student Shapes a Successful Future
Key Performance Indicators The performance frameworks measure attainment on the key performance indicators identified in SB 09-163 as the measures of educational success: • Academic Achievement • 33.3% ELA, 33.3% Math, 33.3% Science • Academic Longitudinal Growth (Colorado Growth Model) • 40% ELA, 40% Math, & 20% English Language Proficiency • Postsecondary and Workforce Readiness • 22.2% Dropout, 22.2% SAT (Read/Math), 11.1% Matriculation, 44.4% Graduation Every Student Shapes a Successful Future
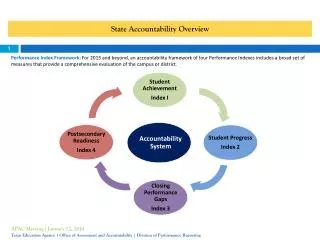
Accountability Impact • These State-identified metrics are combined to produce an overall evaluation of a school’s or district’s performance • The Performance Framework results in Accreditation at the district level, and Plan Types for school level implementation Every Student Shapes a Successful Future
Accreditation and School Plan Types The plan type is based on the total percent of framework points earned out of points eligible: Every Student Shapes a Successful Future
Additional Descriptors • Low Participation • Notated on the ratings for schools and districts with test participation rates below 95 percent • Informational only: Important to note because low participation can impact how well the results reflect the school/district • Decreased due to Participation • Indicates the plan type or rating was lowered one level because assessment participation rates fell below 95 percent in two or more subject areas (Parent refusals are excluded) Every Student Shapes a Successful Future
District Performance Longitudinal DPF: • With the 2019 DPF, APS received the highest overall points that the district has earned on a state accountability framework • APS also improved the overall achievement category for the third year **Note: Accountability data for the 2015 school year is not available due to the one year CDE Accountability pause** Every Student Shapes a Successful Future
School-level Performance Longitudinal School Performance Frameworks: • 79% of APS schools earned a Performance (26 schools) or Improvement rating (18 schools) • Results are preliminary and subject to appeal, on average APS has won 2 – 4 appeals per year, which should improve this distribution • All SPFs are available publically: https://www.cde.state.co.us/schoolview/performance Every Student Shapes a Successful Future
Questions? Every Student Shapes a Successful Future