Download
1 / 40
420 likes | 548 Vues
This resource from the Fiscal Policy Studies Institute in Santa Fe, New Mexico, emphasizes the importance of Results/Outcomes-Based Accountability in assessing the well-being of both populations and clients. By simplifying complex language and concentrating on measurable outcomes, it guides communities—whether cities, counties, or states—in evaluating their performance and identifying effective strategies for improvement. Key concepts include setting clear indicators, understanding baseline conditions, and fostering collaboration among partners to drive meaningful change. For more information, visit [Results Accountability](http://www.resultsaccountability.com).

E N D
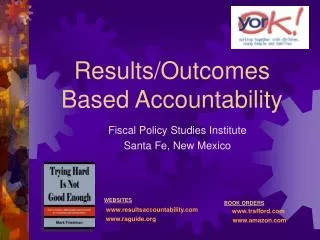
Results/Outcomes Based Accountability Fiscal Policy Studies Institute Santa Fe, New Mexico WEBSITES www.resultsaccountability.com www.raguide.org BOOK ORDERSwww.trafford.com www.amazon.com
SIMPLE COMMON SENSE PLAIN LANGUAGE MINIMUM PAPER USEFUL
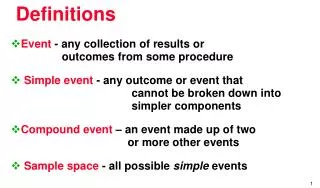
Population Accountabilityabout the well-being ofWHOLE POPULATIONS For Communities – Cities – Counties – States - Nations Performance Accountabilityabout the well-being ofCLIENT POPULATIONS For Programs – Agencies – and Service Systems Results Accountabilityis made up of two parts:
Leaking Roof(Results thinking in everyday life) ? Fixed Experience: Not OK Inches of Water Measure: Turning the Curve Story behind the baseline (causes): Partners: What Works: Action Plan:
Results Accountability COMMON LANGUAGE COMMON SENSE COMMON GROUND
THE LANGUAGE TRAPToo many terms. Too few definitions. Too little discipline Benchmark Outcome Result Modifiers Measurable Core Urgent Qualitative Priority Programmatic Targeted Performance Incremental Strategic Systemic Indicator Goal Measure Objective Target Core qualitative strategic objectives Your made up jargon here Measurable urgent systemic indicators Lewis Carroll Center for Language Disorders
Targeted priority incremental goals • Urgent measurable strategic indicators • Core qualitative systemic results
RESULT or OUTCOME A condition of well-being for children, adults, families or communities. Population INDICATOR or BENCHMARK A measure which helps quantify the achievement of a result. PERFORMANCE MEASURE A measure of how well a program, agency or service system is working.Three types: Performance DEFINITIONS Children born healthy, Children succeeding in school, Safe communities, Clean Environment, Prosperous Economy Children born healthy Children succeeding in school Clean Environment Prosperous Economy Safe communities Rate of low-birthweight babies, Rate of high school graduation, crime rate, air quality index, unemployment rate Rate of low-birthweight babies Rate of high school graduation crime rate air quality index unemployment rate 1. How much did we do? 2. How well did we do it? 3. Is anyone better off? = Customer Results
Population Performance Customer result = Ends Service delivery = Means From Ends to Means From Talk to Action From Talk to Action RESULT or OUTCOME ENDS INDICATOR or BENCHMARK PERFORMANCEMEASURE MEANS
IS IT A RESULT, INDICATOR OR PERFORMANCE MEASURE? 1.Safe Community 2.Crime Rate 3.Average Police Dept response time 4.A community without graffiti 5.% of surveyed buildings without graffiti 6.People have living wage jobs and income 7.% of people with living wage jobs and income 8.% of participants in job training who get living wage jobs RESULT INDICATOR PERF. MEASURE RESULT INDICATOR RESULT INDICATOR PERF. MEASURE
POPULATIONACCOUNTABILITY For Whole Populationsin a Geographic Area Fiscal Policy Studies Institute Santa Fe, New Mexicowww.resultsaccountability.comwww.raguide.org
Every Child Matters – Children ActOutcomes for Children and Young People Being Healthy: enjoying good physical and mental health and living a healthy lifestyle. Staying Safe: being protected from harm and neglect and growing up able to look after themselves. Enjoying and Achieving: getting the most out of life and developing broad skills for adulthood. Making a Positive Contribution: to the community and to society and not engaging in anti-social or offending behaviour. Economic Well-being: overcoming socio-economic disadvantages to achieve their full potential in life.
“We haven’tgot the money, so we’ve gotto think.” Lord Rutherford1871 - 1937
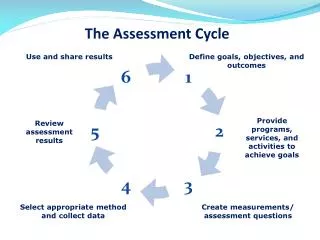
7 Key Questions • What are the quality of life conditions we want for the children, adults and families who live in our community? (Outcome) • What would these conditions look like if we could see them? (Experience) • How can we measure these conditions? (Indicators) • How are we doing on our most important measures? (Baselines) • Who are the partners that have a role to play? • What works, including no cost low cost ideas? • What do we propose to do? (Action Plan)
Turn the Curve Exercise: Population Well-being 5 min: Starting Points- timekeeper and reporter- geographic area- two hats (yours plus partner’s) 10 min: Baseline- pick a result and a curve to turn- forecast – OK or not OK? 15 min: Story behind the baseline- causes/forces at work- information & research agenda part 1 - causes Two pointers to action 15 min: What works? (What would it take?)- what could work to do better?- each partners contribution- no-cost / low-cost ideas- information & research agenda part 2 – what works 10 min: Reportconvert notes to one page
4. --------- Off the Wall ONE PAGE Turn the Curve Report: Population Result: _______________ Indicator(Lay Definition) IndicatorBaseline Story behind the baseline --------------------------- --------------------------- (List as many as needed) Partners --------------------------- --------------------------- (List as many as needed) Three Best Ideas – What Works1. --------------------------- 2. --------------------------- 3. ---------No-cost / low-cost SharpEdges 4. --------- Off the Wall
Performance Accountability For Programs, Agencies and Service Systems Fiscal Policy Studies Institute Santa Fe, New Mexicowww.resultsaccountability.comwww.raguide.org
Population Accountabilityabout the well-being ofWHOLE POPULATIONS For Communities – Cities – Counties – States - Nations Performance Accountabilityabout the well-being ofCLIENT POPULATIONS For Programs – Agencies – and Service Systems Results Accountabilityis made up of two parts:
“All performance measures that have ever existed for any program in the history of the universe involve answering two sets of interlocking questions.”
Performance Measures Quality Quantity HowWell did we do it? ( % ) HowMuch did we do? ( # )
Performance Measures Effort How hard did we try? Effect Is anyone better off?
Effort HowWell HowMuch Effect Performance Measures
Performance Measures Quality Quantity How welldid we deliver it? How much service did we deliver? Effect Effort Output Input How much change / effect did we produce? What quality of change / effect did we produce?
Performance Measures Quality Quantity How welldid we do it? How much did we do? Effect Effort Is anyonebetter off? # %
Drug/Alcohol Treatment Program Quality Quantity How well did we do it? How much did we do? Percent ofstaff withtraining/certification Number ofpersonstreated Effect Effort Is anyone better off? Number of clientsoff of alcohol & drugs- at exit - 12 months after exit Percent of clientsoff of alcohol & drugs- at exit - 12 months after exit
Not All Performance Measures Are Created Equal Quality Quality Quantity How well did we do it? How much did we do? LeastImportant Least AlsoVery Important Effect Effort Is anyone better off? MostImportant Most
Comparing Performance 1. To Ourselves FirstCan we do better than our own history? 2. To OthersWhen it is a fair comparison. 3. To StandardsWhen we know what good performance is.
LR UR
Turn the Curve Exercise: Program Performance 5 min: Starting Points- timekeeper and reporter- identify a program to work on- two hats (yours plus partner’s) 10 min: Performance measure baseline-choose 1 measure to work on – from the lower right quadrant- forecast – OK or not OK? 15 min: Story behind the baseline-causes/forces at work- information & research agenda part 1 - causes Two pointers to action 15 min: What works? (What would it take?)-what could work to do better?- each partners contribution- no-cost / low-cost ideas- information & research agenda part 2 – what works 10 min: ReportConvert notes to one page
4. --------- Off the Wall ONE PAGE Turn the Curve Report: Performance Program: _______________ Performance Measure (Lay definition) PerformanceMeasureBaseline Story behind the baseline --------------------------- --------------------------- (List as many as needed) Partners --------------------------- --------------------------- (List as many as needed) Three Best Ideas – What Works1. --------------------------- 2. --------------------------- 3. ---------No-cost / low-cost SharpEdges 4. --------- Off the Wall
THE LINKAGE Between POPULATION and PERFORMANCE POPULATION ACCOUNTABILITY Healthy BirthsRate of low birth-weight babiesStable FamiliesRate of child abuse and neglectChildren Succeeding in SchoolPercent graduating from high school on time PERFORMANCE ACCOUNTABILITY Child Welfare Program POPULATIONRESULTS Contributionrelationship Alignmentof measures Child Welfare Program # ofinvestigationscompleted % completedwithin 24 hrsof report Appropriateresponsibility # repeatAbuse/Neglect % repeatAbuse/Neglect CUSTOMERRESULTS
Population Accountability Result: to which you contribute to most directly. Indicators: Story: Every timeyou make apresentation, use atwo-partapproach Partners: What would it take?: Your Role: as part of a larger strategy. Your Role Performance Accountability Program: Performance measures: Story: Partners: Action plan to get better:
Board of Directors MeetingAGENDA 1. New data 1. New data 2. New story behind the curves 2. New story behind the curves 3. New partners 3. New partners 4. New information on what works. 4. New information on what works. 5. New information on financing 5. New information on financing 6. Changes to action plan and budget 6. Changes to action plan and budget 7. Adjourn 7. Adjourn
“If you do what you always did,you will get what you always got.” Kenneth W. JenkinsPresident, Yonkers NY NAACP
WEBSITES: www.raguide.orgwww.resultsaccountability.com BOOK ORDERS:www.trafford.comwww.amazon.com THANK YOU !