Download
1 / 1
10 likes | 138 Vues
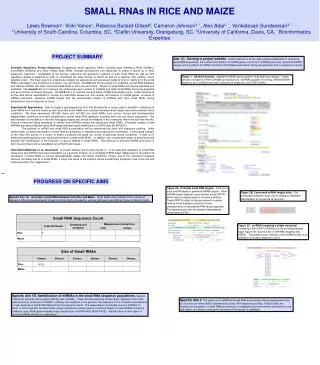
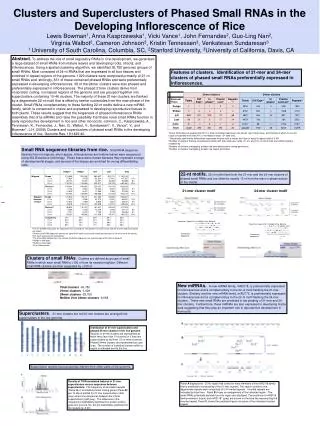
Clusters and Superclusters of Phased Small RNAs in the Developing Inflorescence of Rice Lewis Bowman 1, Vicki Vance 1 , Rebecca Bullard-Dillard 2 , Cameron Johnson 3, * , Alex Adai 3, * , Venkatesan Sundaresan 3, *

E N D
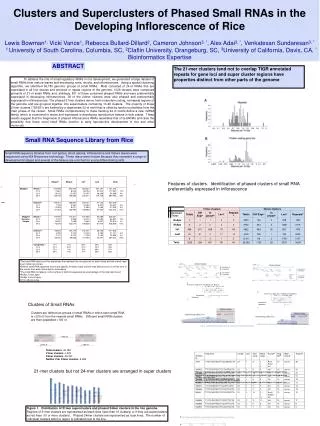
Clusters and Superclusters of Phased Small RNAs in the Developing Inflorescence of Rice Lewis Bowman1, Vicki Vance1, Rebecca Bullard-Dillard2, Cameron Johnson3, *, Alex Adai3, *, Venkatesan Sundaresan3, * 1 University of South Carolina, Columbia, SC, 2Claflin University, Orangeburg, SC, 3University of California, Davis, CA, * Bioinformatics Expertise …..>100 nt…….. …..<100 nt…….. …..<100 nt…….. Total clusters -36,780 21mer clusters -1,029 24mer clusters -29,765 Neither 21or 24mer clusters -6,958 ABSTRACT The 21-mer clusters tend not to overlap TIGR annotated repeats for gene loci and super cluster regions have properties distinct from other parts of the genome To address the role of small regulatory RNAs in rice development, we generated a large dataset of small RNAs from mature leaves and developing roots, shoots, and inflorescences. Using a spatial clustering algorithm, we identified 36,780 genomic groups of small RNAs. Most consisted of 24-nt RNAs that are expressed in all four tissues and enriched in repeat regions of the genome. 1029 clusters were composed primarily of 21-nt small RNAs and, strikingly, 831 of these contained phased RNAs and were preferentially expressed in developing inflorescences. 38 of the 24mer clusters were also phased and preferentially expressed in inflorescences. The phased 21mer clusters derive from nonprotein coding, nonrepeat regions of the genome and are grouped together into superclusters containing 10-46 clusters. The majority of these 21mer clusters (705/831) are flanked by a degenerate 22-nt motif that is offset by twelve nucleotides from the main phase of the cluster. Small RNAs complementary to these flanking 22-nt motifs define a new miRNA family, which is conserved in maize and expressed in developing reproductive tissues in both plants. These results suggest that the biogenesis of phased inflorescence RNAs resembles that of ta-siRNAs and raise the possibility that these novel small RNAs function in early reproductive development in rice and other monocots. Small RNA Sequence Library from Rice Small RNA sequence libraries from root apices, shoot apicies, inflorescence and mature leaves were sequenced using 454 Bioscience technology. These tissue were chosen because they represent a range of developmental stages and several of the tissues are enriched for young differentiating cells. Features of clusters. Identification of phased clusters of small RNA preferentially expressed in inflorescence A A aThe small RNA read count for sequences that matched the rice genome for each tissue and the overall read count (total) are shown. bDistinct small RNA sequence counts are specific for each tissue and the total distinct count is not the sum of the counts from each tissue due to redundancy. cThe small RNA complexity is the number of distinct sequences as a percentage of the total read count. dRoApx is root apex. eShApx is shoot apex. fInfl is inflorescence. B Position Specific Probability Matrix A :51155:221911:8::51197 C :1::31:::::::8:26::::: G :3891::778:89:1:149912 T 91::139:1:11:2:821:::1 Consensus TAGGAATGGGAGGCATCAGGAA Sequence G CT A TG C B Position Specific Probability Matrix A 1:91a:71:119:46982:a99 C :::::::1:1:::211:79:1: G :91911211891a23:21::11 T a1:::a2891:::311:11:11 Consensus TGAGATATTGGAGAAAACCAAA sequence TG GA G C Clusters of Small RNAs Clusters are defined as groups of small RNAs in which each small RNA is <100 nt from the nearest small RNAs. Different small RNA clusters are then separated >100 nt. Table 3. Small RNAs that may target the 22 nt motif associated 21mer phased clusters. 21-mer clusters but not 24-mer clusters are arranged in super clusters aThe tissues or sequencing runs from which the small RNA sequences originate. Run 1 and 2 are sequencing runs from mixed tissues and include material from inflorescence. bThe nucleotide of the small RNA (mostly position 10) after which cleavage in the motif (after position 12) is predicted to occur consistent with the setting of the phase of the 21mer clusters. cThe strand of the motif that the indicated small RNA is predicted to target. dThe number of cluster motifs that are targeted by the indicated small RNA. The selected small RNAs (mostly 22 nt) that are likely to be responsible for the phased 21 nt small RNAs of the 21mer clusters are shown (shaded rows). aThe tissues or sequencing runs from which the small RNA sequences originate. Run 1 and 2 are sequencing runs from mixed tissues and include material from inflorescence. bThe nucleotide of the small RNA (mostly position 10) after which cleavage in the motif (after position 12) is predicted to occur consistent with the setting of the phase of the 21mer clusters. cThe strand of the motif that the indicated small RNA is predicted to target. dThe number of cluster motifs that are targeted by the indicated small RNA. The selected small RNAs (mostly 22 nt) that are likely to be responsible for the phased 21 nt small RNAs of the 21mer clusters are shown (shaded rows). Figure 1. Distribution of 21mer superclusters and phased 24mer clusters in the rice genome. Regions of 21mer clusters are represented as black lines (less than 10 clusters) or if they are superclusters as red lines (10 or more clusters). Phased 24mer clusters are represented as cyan lines. The number of individual clusters within a region is indicated next to the line.