Download
1 / 59
600 likes | 755 Vues
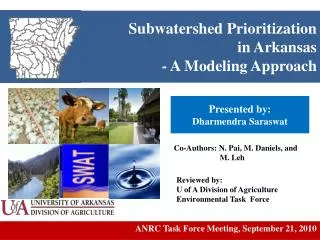
Subwatershed Prioritization in Arkansas - A Modeling Approach. Presented by: Dharmendra Saraswat. Co-Authors: N. Pai , M. Daniels, and M. Leh. Reviewed by: U of A Division of Agriculture Environmental Task Force. ANRC Task Force Meeting, September 21, 2010. MODELING OBJECTIVE.

E N D
Subwatershed Prioritizationin Arkansas- A Modeling Approach • Presented by: Dharmendra Saraswat • Co-Authors: N. Pai, M. Daniels, and M. Leh • Reviewed by: • U of A Division of Agriculture • Environmental Task Force ANRC Task Force Meeting, September 21, 2010
MODELING OBJECTIVE To assist in assessing the relative risk of sub-watersheds (12-digit hydrologic unit code) for sediment and nutrients contribution from selected 8-digit HUC priority watersheds using State-of-the Art modeling techniques Priority Watersheds 12-digit HUC 12-digit HUC Priority ANRC Task Force Meeting, September 21, 2010
MODELING TASKS Collect and organize watershed specific input data for setting up the Soil and Water Assessment Tool (SWAT) model Calibrate and validate the SWAT model for flow, sediment, and nutrients (total phosphorus and nitrate-nitrogen) ANRC Task Force Meeting, September 21, 2010
MODEL PHILOSOPHY Public Domain, supported by USDA-ARS, Worldwide Users and developers base, 682 published articles ANRC Task Force Meeting, September 21, 2010
MODEL PROCESS- LAND PHASE For smallest modeling scale, SWAT simulates spatially-variable soil and water processes that influence movement of nutrients and sediment from land to water (Source: Neitsch et al. 2005) ANRC Task Force Meeting, September 21, 2010
MODEL PROCESS- LAND PHASE Major Simulation Elements • Weather • Hydrology • Plant growth • Erosion • Nutrients (N, P) • Pesticides • Management (Source: Neitsch et al. 2005) ANRC Task Force Meeting, September 21, 2010
MODEL PROCESS- IN-STREAM (Source: Neitsch et al. 2005) ANRC Task Force Meeting, September 21, 2010
MODELING INPUTS- SPATIAL DATA ANRC Task Force Meeting, September 21, 2010
MODELING INPUTS- TABULAR DATA • Average daily loadings for: • water, • sediment, • ammonia, • Carbonaceous biochemical oxygen demand • dissolved oxygen and • phosphorus ANRC Task Force Meeting, September 21, 2010
MODEL EVALUATION PROTOCOL Six components of model evaluation: • Model examination • Algorithm examination • Data evaluation: quality of data • Sensitivity analysis: highest influence • Validation: system performance • Uncertainty analysis (recent trends) (Source: American Society for Testing and Materials, 1984) ANRC Task Force Meeting, September 21, 2010
WHY TAKE ALL THIS TROUBLE? • Reduce potential modeler bias • Provide a road map to follow • Allow other to repeat the study • Improve acceptance of model results ANRC Task Force Meeting, September 21, 2010
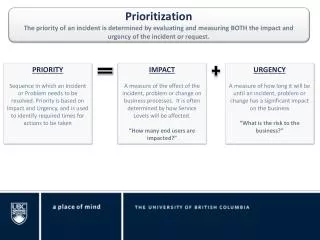
PERCENTILE RANKING Arrange simulated annual pollutant concentration 2. Sort low to high Low To High 3. Calculate rank Tied Rank functionality in Excel 2010 4. Calculate percentile rank ANRC Task Force Meeting, September 21, 2010
CASE STUDY • Beaver Reservoir • Illinois River Drainage Area in Arkansas (IRDAA) • Lake Conway Point Remove (LCPR) • Bayou Bartholomew ANRC Task Force Meeting, September 21, 2010
CASE STUDY ILLINOIS RIVER DRAINAGE AREA IN ARKANSAS (IRDAA) ANRC Task Force Meeting, September 21, 2010
MODEL SETUP- COMPARISON Model: SWAT2005 DEM: 10 m Soil: SSURGO Land Use: 2006 HRUs: Criteria (10% land use, 5% soil type, 0% slope) Ponds: 9019 (3831 acres) Study Period: Calibration: 1996-2005(1992-95) Validation: 2006-2007 Flow at three gages, sediment and nutrients at outlet • Nitrate-nitrogen yield from a few forestry dominated subwatersheds in southern part of IRDAA did not match with expected yield • Lack of all forms of nitrogen data from point sources could result in higher loading from landscape. ANRC Task Force Meeting, September 21, 2010
MODEL SETUP- COMPARISON • Few studies have used watershed models in spatially distributed fashion • Spatially distributed calibration and validation account for hydrologic patterns in subwatersheds* Model: SWAT2009 DEM: 10 m Soil: SSURGO Land Use: 1992, 1993, 1999, 2001, 2004, and 2006 HRUs: 848 Ponds: 9019 (3831 acres) Study Period: Calibration: 1996-2005(1992-95) Validation: 2006-2008 Flow at total seven gages, sediment and nutrients at three * Qi and Grunwald, 2005 ANRC Task Force Meeting, September 21, 2010
DATA USED Weather • NEXT GENERATION RADAR (NEXRAD) * NOAA -NWS ANRC Task Force Meeting, September 21, 2010
DATA USED Point Source Loading • ETF Recommendation: • 4%, 21%, and 75% for ammonia-, organic-, and nitrate-nitrogen- based on ETF recommendation ANRC Task Force Meeting, September 21, 2010
DATA USED Management Data • Poultry litter application adjusted • Litter application rate adjusted for type of grasses and temporally as well* • Cool-season: 2 ton/ac Warm season: 3 ton/ac • January 2004 onwards, rate declined to 1 ton/ac (*Sharpley et al., 2009) ANRC Task Force Meeting, September 21, 2010
CALIBRATION/VALIDATION Subwatershed#16- ~44%, (80%) #19- ~60% (~89%), #18- 24% (~65%) ANRC Task Force Meeting, September 21, 2010
SUBWATERSHED IDENTIFICATION Percentile Approach – Sediment • Highest priority: Soil under Hydrologic Group C & D- 73.4%) HOC, MFL, LOC, SC,MC,SC ANRC Task Force Meeting, September 21, 2010
SUBWATERSHED IDENTIFICATION Percentile Approach – Sediment • Lowest priority: Slopes > 8%- 46.4% Soil under Hydrologic Group C & D- 67.6%) UBC, CH, LW, UMF, UEC ANRC Task Force Meeting, September 21, 2010
SUBWATERSHED IDENTIFICATION Percentile Approach – Total Phosphorus • Highest priority: *Point source affected *23- 303(d) list MFC, HFC, LOC,SC, GC, SC Soil -C & D- 74% ANRC Task Force Meeting, September 21, 2010
SUBWATERSHED IDENTIFICATION Percentile Approach – Total Phosphorus • Lowest priority: LF, CH, LW, UMF ANRC Task Force Meeting, September 21, 2010
SUBWATERSHED IDENTIFICATION Percentile Approach – Nitrate-Nitrogen • Highest priority: *point source affected, 5 is in 303(d) for nitrate Slopes > 8%- 9.6% MFC, LOC, SC, LF, UBC ANRC Task Force Meeting, September 21, 2010
SUBWATERSHED IDENTIFICATION Percentile Approach – Nitrate-Nitrogen • Lowest priority: ANRC Task Force Meeting, September 21, 2010
CASE STUDY BEAVER RESERVOIR WATERSHED (BRW) ANRC Task Force Meeting, September 21, 2010
MODEL SETUP Model: SWAT2009 Delineation: USGS 12-digit HUC DEM: 30 m Soil: SSURGO Land Use: 1992, 1999, 2001, 2004, and 2006 Subwatersheds: 76 HRUs: 2199 (5% land use, 10% soil type, 0% slope) Ponds: 6100 (4857 acres) Study Period: Calibration: 1996-2005 (2003-2005) Validation: 2006-2008 Point Sources: 23 ANRC Task Force Meeting, September 21, 2010
DATA USED Weather • NEXT GENERATION RADAR (NEXRAD) * NOAA -NWS ANRC Task Force Meeting, September 21, 2010
MONITORING GAGES ANRC Task Force Meeting, September 21, 2010
SUBWATERSHED IDENTIFICATION • Highest priority: Percentile Approach – Sediment * PS West Fork - 303(d) – sediment since 1998 , TMDL ANRC Task Force Meeting, September 21, 2010
SUBWATERSHED IDENTIFICATION • Lowest priority: Percentile Approach – Sediment * flatter topography results in lower sediment loss ANRC Task Force Meeting, September 21, 2010
SUBWATERSHED IDENTIFICATION • Highest priority: Percentile Approach – Total P * Point source affected ANRC Task Force Meeting, September 21, 2010
SUBWATERSHED IDENTIFICATION • Lowest priority: Percentile Approach – Total P ANRC Task Force Meeting, September 21, 2010
SUBWATERSHED IDENTIFICATION • Highest priority: Percentile Approach – Nitrogen-N * Point source affected ANRC Task Force Meeting, September 21, 2010
SUBWATERSHED IDENTIFICATION • Lowest priority: Percentile Approach – Nitrogen-N ANRC Task Force Meeting, September 21, 2010
CASE STUDY LAKE CONWAY POINT REMOVE WATERSHED (LCPRW) ANRC Task Force Meeting, September 21, 2010
MODEL SETUP Model: SWAT2009 Delineation: USGS 12-digit HUC DEM: 10 m Soil: SSURGO Land Use: 1999, 2004, and 2006 Subwatersheds: 29 HRUs: 2668 (0% land use, 5% soil type, 0% slope) Ponds: 6100 (4857 acres) Study Period: Calibration: 2001-2005(Flow) Validation: 2006-2008 (Flow) Point Sources: 34 ANRC Task Force Meeting, September 21, 2010
DATA USED Weather • LEAST MONITORED, MOST RAINGAGES ANRC Task Force Meeting, September 21, 2010
DATA USED Management Data • Row Crops : Dominant Crop- Soybean ANRC Task Force Meeting, September 21, 2010
DATA USED Arkansas River as Inlet • USGS gauge near Dardanelle (# 07258000) • Stage-Discharge relationship: • Discharge (cfs) = 7408 x Stage (feet) - 30234; R2 = 0.77 • +/- 23% error in estimating missing data should be expected (J.E. Funkhouser, USGS) ANRC Task Force Meeting, September 21, 2010
CALIBRATION/VALIDATION • Flow calibration: 2001-2005, Validation: 2006-2008 • Land Use of covered subwatersheds: • Forests: 61.7% - 98.4% • Pasture: 1.2% - 35.2% • Urban: 0.1% - 2.7% • Forest (~54%) and Pasture (~22%) • Flow missing: October 2004- September 2005 • October 2007 – September 2008 ANRC Task Force Meeting, September 21, 2010
SUBWATERSHED IDENTIFICATION Percentile Approach – Sediment • Highest priority: Subwatershed #18- Beaverdam Creek ANRC Task Force Meeting, September 21, 2010
SUBWATERSHED IDENTIFICATION Percentile Approach – Sediment • Lowest priority: ANRC Task Force Meeting, September 21, 2010
SUBWATERSHED IDENTIFICATION Percentile Approach – Total Phosphorus • Highest priority: • Soils C & D • *Low streamflow ANRC Task Force Meeting, September 21, 2010
SUBWATERSHED IDENTIFICATION Percentile Approach – Total Phosphorus • Lowest priority: ANRC Task Force Meeting, September 21, 2010
SUBWATERSHED IDENTIFICATION Percentile Approach – Nitrate-Nitrogen • Highest priority: • #6- Whig Creek (10 mi) • #17- City of Conway WWTP ANRC Task Force Meeting, September 21, 2010
SUBWATERSHED IDENTIFICATION Percentile Approach – Nitrate-Nitrogen • Lowest priority: ANRC Task Force Meeting, September 21, 2010
CASE STUDY BAYOU BARTHOLOMEWWATERSHED (BBW) ANRC Task Force Meeting, September 21, 2010
MODEL SETUP Model: SWAT2009 Delineation: USGS 12-digit HUC DEM: 10 m Soil: SSURGO Land Use: 1992, 1999, 2004, and 2006 Subwatersheds: 44 HRUs: 3657 (0% land use, 5% soil type, 0% slope) Study Period: Calibration: 1996-2005 Validation: 2006-2008 (2004-2008)-Portland Point Sources: 9 ANRC Task Force Meeting, September 21, 2010