Download
1 / 16
160 likes | 189 Vues
Get information about the Lower Columbia River Conservation and Recovery Plan's annual implementation team meeting held on August 19, 2013. Find details about the agenda, goals, annual report, challenges, and actions taken by the Oregon Department of Fish and Wildlife (ODFW) for the recovery of species in the ESU. Explore the ODFW Recovery Tracker and Annual Report for more information.

E N D
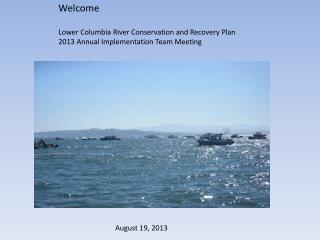
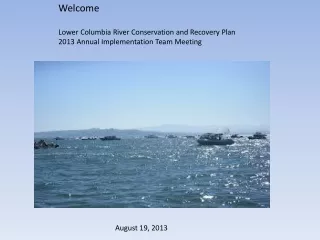
Welcome Lower Columbia River Conservation and Recovery Plan 2013 Annual Implementation Team Meeting August 19, 2013
General Info • Cell phones • Restrooms • Agenda • Goals • Annual report • 3YIS and the priority ranking • Role of the IT • Challenges across the ESU • ODFW actions
ODFW Recovery Tracker http://www.odfwrecoverytracker.org/ • “Explore Recovery” button, then select: • species of interest • ESU • Stratum • Independent Population • metric Click Here
Annual Report http://www.dfw.state.or.us/fish/CRP/lower_columbia_plan.asp
Annual Report • Summarizes monitoring metrics and actions during a given reporting period • Called for in the plan (Action #Trib-46) • Shared with implementers, funding entities, the IT, Recovery and Oregon Plan Teams, public • Used to assess the effectiveness of implementation at the population and ESU level • Used as an early warning indicator • Hypothetical Example of early warning indicator • 90% Threshold-Occupancy of Habitat • Measurable Criteria-Spatial Structure • Percentage of sites not occupied must be less than 10% at least 6 times in a 12 year period • Average percent occupancy of habitat must be greater than 90% after 12 years • Year 8 in Ex1, Year 6 in Ex 2 • A place to formerly document adaptive management decisions and actions
Yearly abundance goals will fluctuate with harvest rates and annual climate indices • Yearly abundance estimates assume full recovery and are buffered against climate change A brief explanation is provided for how the data were collected • pHOS-the graph shows the yearly pHOS, desired delisting goal, broad sense goal and the running 9 year average (a test metric) • Percent occupancy of habitat-the graph shows the yearly occupancy and compares to the broad sense and desired delisting goals
Coho Desired Delisting Abundance Goals A down year across the ESU Measurable Criteria is the observed spawner abundance greater than the abundance goals at least six times in a 12 year period? • Percent occupancy of habitat is based on the number of times the target is reached over a 12 year period
Spring Chinook Methodology to determine wild abundance for ChS in the Hood River has not been finalized since removal of Powerdale Dam in 2010 • Sandy pHOS is one year post Marmot Dam removal • Hood pHOS is not given since this is a conservation program • Percent occupancy of habitat methodology has yet TBD
For each independent population there is a list of known restoration projects completed during the reporting period Figure 9 is based upon completed projects
Ability to meet goals is heavily driven by FCRPS Bi-OP in tidal portions of streams Although the goals are measured at the population level we are on track at the stratum and ESU scale for miles of riparian area treated but are not on track for miles of LWD treatment
This graph is not in the annual report • Clatskanie expenditures include 5.3 M for CSR acquisition • Clack expenditures include 7.3M in Johnson Creek • Hood expenditures include 2M for Polallie Creek Bridge • Sandy expenditures include 4M for Cedar Creek Hatchery next 3 YIS will look at priority projects completed