Download
1 / 64
660 likes | 910 Vues
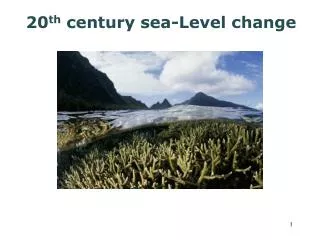
Lecture 24: Tides and Sea Level Change. GEOS 655 Tectonic Geodesy Jeff Freymueller. Topics Today. Tides Tide Gauges and Measurement of Tides and sea level variations Tide surveys and tidal benchmark surveys Long-term tidal records Sea level history

E N D
Lecture 24: Tides and Sea Level Change GEOS 655 Tectonic Geodesy Jeff Freymueller
Topics Today • Tides • Tide Gauges and Measurement of Tides and sea level variations • Tide surveys and tidal benchmark surveys • Long-term tidal records • Sea level history • The Sea level equation and ocean function
Tides as a Measure of Changing g • Tides are the most obvious change in gravity, caused by the attraction of the moon and sun. • Solid earth deforms due to changing tidal gravitational potential (solid earth tide) • Ocean water flows around due to changing potential (ocean tides) • Solid earth deforms due to changing load of ocean tides (ocean tidal loading) • Tidal bulge is two-sided because of earth rotation, and because Earth is orbiting about CM of Earth-Moon system • Tidal potential (gravitational potential) varies with position of Moon and Sun relative to Earth. • Tidal variations generally described as a sum of harmonic terms.
Tidal Friction • Earth’s tidal bulge would get ahead of Moon position because of rotation of Earth • Tidal friction slows Earth rotation and increases orbital radius of Moon • Length of day has increased ~10% since Devonian, present rate of change about 0.002 sec/year • Geodetic observations of change in length of day reflect mostly exchange of angular momentum between solid earth and hydrosphere.
Tidal Potential • We can compute the tidal potential at any point on the Earth’s surface from basic physics From the Law of Cosines: b R Y r
Tidal Potential Terms • First order approximation: distance to Moon is constant. • First term is constant • Second term relates to orbit of Earth around CM of Earth-Moon system • Third and following terms are tidal potential. • We’ll look at that third term in more detail.
Relation of Y to Lat-Long • The angle Y is measured in the plane defined by the vectors p and m, • Define (q,f) as as co-latitude + logitude of P • Define (qm,fm) as co-latitude + longitude of Moon (varies) • Longitude changes by 2p per day (non-rotating coordinate system) P p Y To Moon m
Periods of these terms • Semi-diurnal tide • Undergoes a complete cycle every time 2(f-fm) changes by 2p, roughly twice a day • Amplitude varies over course of lunar month • Diurnal tide • Undergoes a complete cycle every time (f-fm) changes by 2p, roughly once a day • Amplitude varies over course of lunar month • Fortnightly tide • Undergoes a complete cycle twice per lunar month • Plus higher order terms from ellipticity of Moon’s orbit.
Solar Tides • Solar tides come from the same causes as lunar tides. • Magnitude ~0.42 of lunar tides due to ratio of masses and ratio of distances cubed. • Solar tides include semi-diurnal and diurnal, but vary with year rather than lunar month • Solar tidal components may be out of phase with lunar components
Tidal Components are Named • Only major tidal components listed here • Lunar tides • Semi-diurnal M2 • Diurnal K1, O1 • Elliptical J1, L1, K2, L2 • Solar Tides • Semi-diurnal S2 • Diurnal P1 • Elliptical R2, T2 • See http://en.wikipedia.org/wiki/Theory_of_tides The M2 tide is very large in Alaska due to a resonance in the Gulf of Alaska
Predicting Tides • The periods of the tidal harmonic components are known. • Tides can be predicted forward in time by fitting amplitudes and phases for each harmonic component based on some data. • Non-tidal components include: • Storms and storm surges • Variations in currents/salinity • El Niño/La Niña • Pacific Decadal Oscillation and other basin-scale variations • Some of the non-tidal components repeat seasonally
Example Tide Gauge Site Oldest continuous tide gauge site: Amsterdam, since 1700
Classical Float Gauge (from about 1832)
UK Float Gauge at Holyhead Float gauges are still important and can be made into digital gauges with the use of encoders
Tidal Harmonic Components • Twenty largest harmonic components at Kodiak Island • Const# Name Amplitude Phase Speed (= degrees/hour = 360/period) • ------ ---- --------- ----- ----------- • 1 M2 3.192 308.1 28.9841042 ( = 12.4 hours) • 4 K1 1.306 288.6 15.0410686 ( = 23.93 hours) • 2 S2 1.066 341.4 30.0000000 • 6 O1 0.850 273.0 13.9430356 • 3 N2 0.659 284.2 28.4397295 • 30 P1 0.413 284.4 14.9589314 • 35 K2 0.295 332.8 30.0821373 • 22 SA 0.256 262.1 0.0410686 (= 1 year) • 26 Q1 0.154 264.8 13.3986609 • 11 NU2 0.128 284.2 28.5125831 • 33 L2 0.079 321.0 29.5284789 • 14 2N2 0.079 258.9 27.8953548 • 19 J1 0.075 297.9 15.5854433 • 13 MU2 0.072 277.1 27.9682084 • 24 MF 0.066 165.2 1.0980331 ( = 13.6 days) • 27 T2 0.062 329.5 29.9589333 • 20 MM 0.062 191.7 0.5443747 • 23 MSF 0.049 51.5 1.0158958 • 21 SSA 0.049 151.7 0.0821373 • 18 M1 0.046 293.2 14.4966939
Tidal Benchmark Surveys • In addition to permanent tide gauges, there are many tidal benchmarks, which have been surveyed relative to tide level. • Good tidal benchmark surveys include 2-3 months of temporary tide gauge surveys to measure major tidal components. • Shorter tidal benchmark surveys use nearby permanent tide gauges or even tide tables.
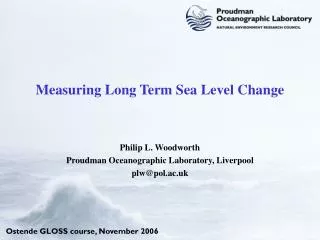
Sea Level Monitoring • Each country operates its own tide gauges, data coordinated through international organizations • PSMSL = Permanent Service for Mean Sea Level • Under ICSU • Archives tide gauge data from almost 2000 global stations • GLOSS = Global sea Level Observing SyStem • Under WMO • The main component of GLOSS is the 'Global Core Network' (GCN) of 290 sea level stations around the world for long term climate change and oceanographic sea level monitoring. • Also Long-term trends network fed to IPCC, etc.
Measuring Sea Level Changes Altimeter System Bottom Pressure Gauge Tide Gauge (float) http://www.pol.ac.uk/psmsl/programmes/gloss.info.html
Sea-Level Changes • Different Time-Scales • Momentary changes due to tsunamis • Daily changes due to tides and surges • Seasonal changes • Interannual changes e.g. due to ENSO • Long term changes due to climate change • Causes of Sea Level Change • Local processes in river/coastal regimes • Ocean circulation changes • Regional and global climate changes • Geological processes Maldives Int. Airport http://www.pol.ac.uk/psmsl/programmes/gloss.info.html
Long Term Changes in Sea Level • Past 100 years • Most records show evidence for • rising sea levels during the past • century • IPCC concluded that there has • been a global rise of • approximately 10-20 cm • during the past 100 years http://www.pol.ac.uk/psmsl/programmes/gloss.info.html
Long Term Changes in Sea Level • Next 100 years • a rise between 9 and 88 cm • a central value of 48 cm • a rate of approx. 2.2 - 4.4 • times that of the past • 100 years Projected sea level rise, IPCC 2001 http://www.pol.ac.uk/psmsl/programmes/gloss.info.html
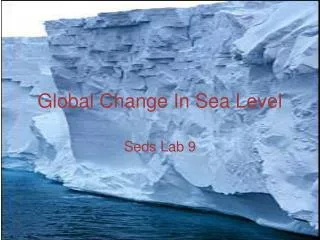
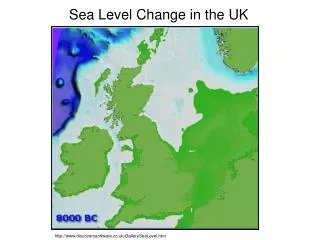
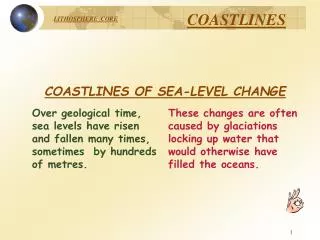
Long Term Sea Level Changes • We know from geologists that sea level has changed over many 1000s of years largely as a result of the exchanges of water between the ocean and ice caps • So we should not be too surprised if sea level is still changing
How is water redistributed? • If water is added to the oceans (from melting glaciers, for example), how is it distributed? • Small changes • Added to present ocean areas, not land. Distribution of ocean described by ocean function. • Large Changes • For the melting of large amounts of ice (Greenland or Antarctica), you have to account for the changes in bathymetry of oceans due to GIA, and also the changes in ocean area as sea level rises onto coastal plains.
Ocean Function white = 1; green = 0
Two Main Problems with the Present ‘Global’ Sea Level Data Set • Coverage is not uniform around the globe. • ‘Sea Level’ measurements are relative to land level. Land level may be changing, too. SOLUTION (to #2)Measure Land Levels using new geodetic techniques such as GPS and Absolute Gravity
Two Main Geodetic Tools for Measuring Land Level Changes GPS Absolute Gravity
Questions and Answers • Q. Has global sea level risen during the 20th • century ? • Yes. By 10-20 cm. • There are many references, see the IPCC Fourth Assessment Report for a review
20th Century Sea Level Rise Estimates Region, VLM Rate ± s.e. (mm/yr) Gornitz and Lebedeff (1987) Global, Geological 1.2 + 0.3 Peltier and Tushingham (1989, 1991) Global, ICE-3G/M1 2.4 + 0.9c Trupin and Wahr (1990) Global, ICE-3G/M1 1.7 + 0.13 Nakiboglu and Lambeck (1991) Global decomposition 1.2 + 0.4 Shennan and Woodworth (1992) NW Europe, Geological 1.0 + 0.15 Gornitz (1995)d NA E Coast, Geological 1.5 + 0.7c Mitrovica and Davis (1995), Davis and Mitrovica (1996) Far field, PGR Model 1.4 + 0.4c Davis and Mitrovica (1996) NA E Coast, PGR Model 1.5 + 0.3c Peltier (1996) NA E Coast, ICE-4G/M2 1.9 + 0.6c Peltier and Jiang (1997) NA E Coast, Geological 2.0 + 0.6c Peltier and Jiang (1997) Global, ICE-4G/M2 1.8 + 0.6c Douglas (1997)d Global ICE-3G/M1 1.8 + 0.1 Lambeck et al. (1998) Fennoscandia, PGR Model 1.1 + 0.2 Woodworth et al. (1999) UK & N Sea, Geological 1.0 + 0.2 N.B. All these analyses use the same PSMSL data set
Questions and Answers Q. Do we understand why it has risen? A. Yes. (Or at least ‘more or less’)
Why has sea level risen? Main driver has been the 0.6 ºC global temperature change during the past century but there have been many contributors to the sea level change. See IPCC 4AR for a review.