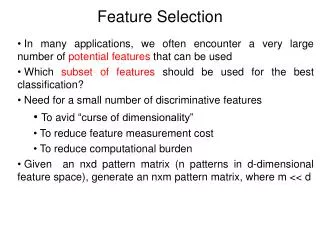
Feature Selection with Mutual Information and Resampling
430 likes | 593 Vues
Feature Selection with Mutual Information and Resampling. M. Verleysen Université catholique de Louvain (Belgium) Machine Learning Group http://www.dice.ucl.ac.be/mlg/ Joint work with D. François, F. Rossi and W. Wertz. High-dimensional data: Spectrophotometry.

Feature Selection with Mutual Information and Resampling
E N D
Presentation Transcript
Feature Selection with Mutual Information and Resampling M. Verleysen Université catholique de Louvain (Belgium) Machine Learning Group http://www.dice.ucl.ac.be/mlg/ Joint work with D. François, F. Rossi and W. Wertz.
High-dimensional data: Spectrophotometry To predict sugar concentration in an orange juce samplefrom light absorbtion spectra 115 samples in dimension 512 Even a linear model would lead to overfitting !
Material resistance classification • Goal: to classify materials into “valid”, “non-valid” and “don’t know”
Material resistance: features extraction • Extraction of whateverfeatures you would imagine …
Why reducing dimensionality ? • Theoretically not useful : • More information means easier task • Models can ignore irrelevant features (e.g. set weights to zero) • Models can adjust metrics « In theory,practice and theory are the same. But in practice,they're not » • Lot of inputs means … Lots of parameters & high-dimensional input space Curse of dimensionality and risks of overfitting !
Reduced set of variables • Initial variables • Reduced set: • selection or • projection • Advantages • selection: interpretability, easy algorithms • projection: potentially more powerful x1, x2, x3, …, xN x2, x7, x23, …, xN-4 y1, y2, y3, …, yM (where yi = f (wi , x))
Feature selection • Initial variables • Reduced set: • Selection • Based on sound statistical criteria • Makes interpretation easy: • x7, x23 are the variables to take into account • set {x7, x23} is as good as set {x2, x44, x47} to serve as input to the model x1, x2, x3, …, xN x2, x7, x23, …, xN-4
Feature selection • Two ingredients are needed: • Key Element 1 : Subset relevance assessment • Measuring how a subset of features fits the problem • Key Element 2 : Subset search policy • Avoiding to try all possible subsets
Feature selection • Two ingredients are needed: • Key Element 1 : Subset relevance assessment • Measuring how a subset of features fits the problem • Key Element 2 : Subset search policy • Avoiding to try all possible subsets
Optimal subset search • Which subset is most relevant ? [ ] [X1X2X3X4] NP problem : exponential in the number of features
Option 1: Best subset is … subset of best features • Which subset is most relevant ? • Hypothesis : Best subset is the set of K most relevant features [X1 X2 X3 X4] Naive search (Ranking)
Ranking is usually not optimal • Very correlated features • Obviously, close features will be selected!
Option 2: Best subset is … approximate solution to NP problem • Which subset is most relevant ? • Hypothesis : Best subset can be constructed iteratively Iterative heuristics
About the relevance criterion The relevance criterion must deal with subsets of variables !
Feature selection • Two ingredients are needed: • Key Element 1 : Subset relevance assessment • Measuring how a subset of features fits the problem • Key Element 2 : Subset search policy • Avoiding to try all possible subsets
Mutual information • Mutual information is • Bounded below by 0 • Not bounded above by 1 • Bounded above by the (unknown) entropies
Mutual information is difficult to estimate • probability density functions are not known • integrals cannot be computed exactly • X can be high-dimensional
Estimation in HD • Traditional MI estimators: • histograms • kernels (Parzen windows) NOT appropriate for high dimension • Kraskov's estimator (k-NN counts) Still not very appropriate, but works better ... Principle: when data are close in the X space, are the corresponding Y close too ?
Kraskov's estimator (k-NN counts) • Principle: to count the # of neighbors in X versus the number of neighbors in Y Y Y X X
Kraskov's estimator (k-NN counts) • Principle: to count the # of neighbors in X versus the number of neighbors in Y Y Y X X Nearest neighbors in X and Y coincide: high mutual information Nearest neighbors in X and Y do not coincide: low mutual information
MI estimation • Mutual Information estimators require the tuning of a parameter: • bins in histograms • Kernel variance in Parzen • K in k-NN based estimator (Kraskov) • Unfortunately, the MI estimator is not very robust to this parameter…
Robustness of MI estimator • 100 samples
Sensitivity to stopping criterion • Forward search: stop when MI does not increase anymore • In theory: is it valid?
Sensitivity to stopping criterion • Forward search: stop when MI does not increase anymore • In theory: is it valid? • Answer: NO, because
Sensitivity to stopping criterion • Forward search: stop when MI does not increase anymore • In theory: NOT OK! • In practice: ???
In summary • Two problems: • The number k of neighbors in the k-NN estimator • When to stop?
Number of neighbors? • How to select k (the number of neighbors)?
Number of neighbors? • How to select k (the number of neighbors)? • Idea: compare the (distributions of) the MI between Y and • a relevant feature X • a non-relevant one Xp.
The best value for k • The optimal value of k best separates the distributions (ex: Student-like test)
How to obtain these distributions? • Distribution of MI(Y, X ): • use non-overlapping subsets X[i] • compute I (X[i] , Y) • Distribution of MI(Y, Xp): eliminate the relation between X and Y • How? Permute X -> Xp • use non-overlapping subsets Xp[j] • compute I (Xp[j] , Y)
The stopping criterion • Observed difficulty: the MI estimation depends on the size of the feature set: even if MI (Xk,Y ) = 0. • Avoid comparing MI on subsets of different sizes! • Compare with
The stopping criterion 95% percentiles of the permutation distribution
The stopping criterion • 100 datasets (MC simulations)
"Housing" benchmark • Dataset origin: StatLib library, Carnegie Mellon Univ. • Concerns housing values in suburbs of Boston • Attributes: • CRIM per capita crime rate by town • ZN proportion of residential land zoned for lots over 25,000 sq.ft. • INDUS proportion of non-retail business acres per town • CHAS Charles River dummy variable (= 1 if tract bounds river; otherw. 0) • NOX nitric oxides concentration (parts per 10 million) • RM average number of rooms per dwelling • AGE proportion of owner-occupied units built prior to 1940 • DIS weighted distances to five Boston employment centres • RAD index of accessibility to radial highways • TAX full-value property-tax rate per $10,000 • PTRATIO pupil-teacher ratio by town • B 1000(Bk - 0.63)^2 where Bk is the proportion of blacks by town • LSTAT % lower status of the population • MEDV Median value of owner-occupied homes in $1000's
The stopping criterion • Housing dataset
The stopping criterion • Housing dataset RBFN performances on test set: - all features: RMSE = 18.97 - 2 features (max MI): RMSE = 19.39 - Selected features: RMSE = 9.48
The stopping criterion • Spectral analysis (Nitrogen dataset) • 141 IR spectra, 1050 wavelengths • 105 spectra for training, 36 for test • Functional preprocessing (B-splines)
The stopping criterion • Spectral analysis (Nitrogen dataset) RBFN performances on test set: - all features: RMSE = 3.12 - 6 features (max MI): RMSE = 0.78 - Selected features: RMSE = 0.66 SHANGHAÏ
The stopping criterion • Delve-Census dataset • 104 features used • 22784 data • 14540 for test • 8 x 124 for training (to study variability)
The stopping criterion • Delve-Census dataset
The stopping criterion • Delve-Census dataset • RMSE on test set
Conclusion • Selection of variables by Mutual Information may improve learning performancesand increases interpretability … • …if used in an adequate way ! • Reference: • D. François, F. Rossi, V. Wertz and M. Verleysen, Resampling methods for parameter-free and robust feature selection with mutual information, Neurocomputing, Volume 70, Issues 7-9 , March 2007, Pages 1276-1288 • Thanks to my co-authors for (most part of…) the work!