NISMOD-DB: Advanced Visualization and Analysis Toolkit for Spatial Network Infrastructure
NISMOD-DB is a cutting-edge system designed for the visualization, storage, analysis, and dissemination of various regional and national spatial networks. It supports data import/export in formats such as GEXF, PAJEK, YAML, and more. Functioning as a relational database with robust spatial and network features, it allows for comprehensive analysis and visualization of infrastructure performance. The project integrates metrics calculations, dependency links, and advanced dashboards for effective management of infrastructure capacity and demand.

NISMOD-DB: Advanced Visualization and Analysis Toolkit for Spatial Network Infrastructure
E N D
Presentation Transcript
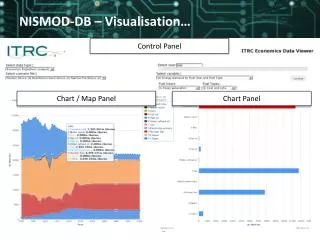
NISMOD-DB – Visualisation… Control Panel Chart / Map Panel Chart Panel
NISMOD-DB for Networks • Architecture to handle various regional and national scale spatial networks • Storage • Analysis • Visualisation
NISMOD-DB for Networks… Import / export graph: GEXF, PAJEK, YAML, GRAPHML, CSV, JSON Calculate metrics: wrap NetworkX algorithms, can add custom calculations Publish networks: Interface with Geoserver WMS via gsconfig (in dev) Network Database Schema nx_pgnet nx_pg NetworkX
NISMOD-DB for Networks… • UK Road • OS Meridian (24071 nodes, 50292 edges) • OS Strategi (18066 nodes, 28089 edges) • UK Rail (2526 stations, 1415 junctions) • UK National Grid-owned Electricity Transmission • Generation Stations, Interconnectors, Substations (643 nodes) • Underground cables, Overhead lines, Interconnectors (759 edges) • UK National Grid-owned Gas Transmission • Offtakes, Block Valves, Compressors, Storage Sites, LNG Sites, Terminals, Pipelines plus more (625 nodes, 679 edges) NISMOD-DB – Networks… Topographical View Topological View Metric View
Example: Network analysis, London, UK Substations Tube stations Dependency links GUI for network analysis
Future Work… • Complex sets of outputs from infrastructure capacity and demand modelling (NISMOD-LP) • Integration of inputs/outputs within NISMOD-DB • Web services for remote execution • Development of infrastructure data dashboards • Extension of current dashboards per sector • Single, integrated interface for all sectors • Development of visualisations for investigating and disseminating infrastructure performance • Development of network visualisation • Use of network visualisation tools for NISMOD-LP • Further development of network visualisation dashboards for failure simulation • Extension of network module for end-to-end network construction, storage, analysis and dissemination
Summary • Data available on many aspects of infrastructure • Management, provenance, analysis and dissemination key to effective research • Relational database, with spatial and network extensions being developed as part of UK ITRC to: • Handle model outputs for future capacity and demand under range of different scenarios • Build, store and manage networks • Disseminate data via prototype visualisation tools
Links • Infrastructure Transitions Research Consortium www.itrc.org.uk http://gow.epsrc.ac.uk/NGBOViewGrant.aspx?GrantRef=EP/I01344X/1 • School of Civil Engineering and Geosciences, Newcastle University www.ceg.ncl.ac.uk • Geospatial Engineering Group@ Newcastle http://www.ncl.ac.uk/ceg/research/geomatics/geospatialengineering/ • Geospatial Engineering Group Blog @ Newcastle http://blogs.ncl.ac.uk/geospatialengineering • Centre for Earth System’s Engineering Research (CESER) @ Newcastle http://www.ncl.ac.uk/ceser/
Thank you. David.Alderson@ncl.ac.uk Stuart.Barr@ncl.ac.uk C.A.Robson1@ncl.ac.uk Alexander.Otto@ouce.ox.ac.uk Jim.Hall@eci.ox.ac.uk Scott.Thacker@ouce.ox.ac.uk Raghav.Pant@ouce.ox.ac.uk