Download
1 / 57
570 likes | 671 Vues
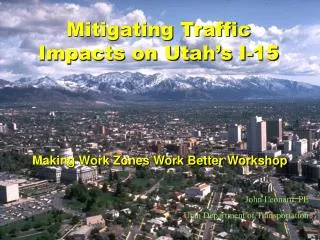
Mitigating Traffic Impacts on Utah’s I-15. Making Work Zones Work Better Workshop. John Leonard, PE Utah Department of Transportation. Seattle. 15. Portland. 84. Chicago. New York. 80. 80. 80. Salt Lake City. Washington. Denver. St. Louis. San Francisco. 15. Los Angeles.

E N D
Mitigating Traffic Impacts on Utah’s I-15 Making Work Zones Work Better Workshop John Leonard, PE Utah Department of Transportation
Seattle 15 Portland 84 Chicago New York 80 80 80 Salt Lake City Washington Denver St. Louis San Francisco 15 Los Angeles Atlanta Dallas Miami Utah - Crossroads of the West
10800 South 600 North Project Limits
Project Scope • 17 miles of Interstate Highway • Utah’s First Car Pool Lanes • 8 Major Interchanges Reconstructed • 3 Freeway to Freeway Junctions Rebuilt • 144 Bridges Replaced • 9 Million Cubic Yards of Embankment • 3.4 Million Square Yards of Pavement • Program Cost $1.59 Billion
Social and Traffic Trends
Utah’s Urban Population, Employment & Interstate Vehicle Miles of travel Percent of Growth 200 175 Interstate VMT 150 Employment 125 Population 100 75 50 25 0 1980 1985 1990 1995 Year
Background • Early Public Perception • Freeway is working OK—why do we need to rebuild? • No public will to endure major construction • No public desire to fund major project • “We will take care of it when it gets bad”
Background • By 1994, public begins to believe freeway needs to be rebuilt • Congestion and travel times increasing • Major deterioration visible • 1995, UDOT created a team to lead the Project and move it to completion • Project Director • Financial Manager • Structures • Design • MOT/Operations • Staff Support
Background • FEIS process • Formal public meetings • Open houses • Community Councils • Citizens groups • NEPA process • Over 130 separate meetings
Conclusion of Research (1995) The public would prefer a greater level of impact in exchange for a shorter construction duration
Research “Get in, Get it Done, And Get out!!”
Background • Original concept was traditional construction • Design-Bid-Build • 8-10 year duration • Investigated different and innovative design and construction strategies • Design/Build was chosen in January ‘96 • Construct project in 4 ½ years
Maintenance of Traffic • Large impact to traffic patterns • We need to take a different approach to managing traffic during construction
Maintenance of Traffic • The UDOT I-15 Team Approach • UDOT • Contractor • DAQ • Local Communities • Emergency Services • Public!!!!
Team Approach • Maintenance of Traffic • Transportation Demand Management • Public Information Plan
Maintenance of Traffic • Development of impact mitigation alternatives • Parallel street projects • Capacity improvements on corridors
Cost Influence Curve Conceptual Planning High High Design Ability to Influence Cost Project Expenditures Procurement Construction Start-up Low Low Complete Start Time DBIA
Process • Involvement process began early • Met with mayors, city engineers, and public works directors of affected jurisdictions • 6 Cities, 1 County on corridor • 8 Cities, 1 County off corridor • Received endorsement for D/B concept • Presented preferred alternative and potential construction schedule
Parallel Streets • Reviewed routes along the corridor • Identified capacity constraints, community issues, and possible alternate routes • Identified 21 potential projects to make improvements • Used a macroscopic model to evaluate potential improvements • 9 projects recommended for construction, with a value of $50 Million
Parallel Street Projects • 2 projects were ‘on the shelf’ • Had completed EIS’s • Widened a parallel route from 2 to 6 lanes • Remainder were ‘spot improvements’ • Removed choke points • Removed medians and added lanes • Enhanced intersection capacity
Parallel Street Projects • All projects were to be ‘fast track’ advertised by early 1996, with required completion prior to major construction beginning in summer 1997 • UDOT Region assisted both with design and project oversight
Emergency Responders • Facilitated cooperative meetings among all emergency agencies • Law enforcement • Fire • Medical
Emergency Responders • Created command structure, and created cross jurisdictional responses • Best able to respond • Utah Highway Patrol was lead law enforcement agency • Alleviated fears of increased response time
Trucking Industry • Large impacts to interstate travel • Crossroads of the west • Need to coordinate with closures • Provide real time information for routing • Detours to local streets for LCV’s and Hazmat carriers
Business Community • Hosted business fairs • Encouraged flexible schedules • Car pools • Telecommuting • “how to cope’ seminars • Print ready materials
Transportation Demand Management • A variety of methods for reducing transportation demand on the street system. • Coordination with existing Utah Transit Authority programs: • Employee-sponsored bus passes (deep discount program) • Rideshare (carpooling) - computerized rider matching program • Vanpool (UTA financed van purchase or lease) • Other trip reduction strategies • Flextime • Telecommuting • Public Information Plan
Public Information Plan Challenges • Creating partnerships with the media, Communities, Businesses, and Public • Convincing a change in driver habits -- promoting the benefits • Communicating the vision
Public Information Plan • Information to the public • What’s the schedule? • What is open and closed? • How do we cope? • Information from the public
Request for Proposals • Set the framework for the contract • Laid down the ground rules • Provided contractor with flexibility, but with constraints • Assigned risk to those who could best handle it • Issued October, 1996 • Best and Final Offer in February, 1997
Request for Proposals • Maintenance of Traffic Specification • Responded to community concerns • Provided maximum flexibility • Allowed for innovation
Maintenance of TrafficPerformance Specification • I-15 Mainline • 2 lanes open each direction during peak hours • Peak Hours • 6 AM to 10 PM weekdays • 8 AM to 7 PM weekends • Junctions • maintain freeway to freeway movements through existing ramps or freeway detours • Downtown • 2 accesses open at all times
Maintenance of TrafficPerformance Specification • Interchanges • cross streets at interchanges may be closed for a maximum of 6 months • This may occur IF one is south of the I-15/I-215 Junction, and one is north of it. • complete remaining construction in following 6 months • close movement if it is available at adjacent interchange
Maintenance of TrafficPerformance Specification • Other • Coordination with ATMS system • Provide off-duty uniformed officer and car on the corridor • Provide motorist guidance • Aid in emergency response • Provide a courtesy patrol • Provide emergency pullouts every km
The Selection Process Technical Proposal Price
Proposal Evaluation • Price and technical proposals had equal weight • Maintenance of traffic was 1 of 6 technical areas • Proposals were evaluated for ‘Best Value’
EVALUATION FACTORS • Technical Solutions • Maintenance of Traffic • Geotechnical • Structures • Pavement • Maintainability • Aesthetics, Drainage, Roadway Geometry, Lighting, Traffic Signals, Signing, Water Quality, Harmful/Hazardous Materials Remediation, Concrete Barriers, and ATMS • Work Plan/Schedule • Management • Organizational Qualifications • Price
Proposals • Enhancements by successful proposer • Maintain 3 lanes on southern end of project through junction with I-215 • Restripe west side of I-215 belt route to 4 lanes each direction • Required modification and enhancements • Reduce interchange cross street closure to 4 months • Expanded use of night operations • Freeway closures in the off-peak hours
Proposals • Enhancements by successful proposer • Added courtesy patrol to west side belt route • Expanded use of off-duty law enforcement • Much simpler construction phasing • Better driver expectancy • Opened south end of project 1 year early
Proposals • Enhancements by successful proposer • Provided glare screen entire length of corridor to reduce construction ‘gawking’ and improving capacity • Use of ITS elements as they became available • Dedicated staff for both design and implementation of MOT
Coordination • Weekly meetings with UDOT, the contractor, design, UHP, all Segments, public information, and local jurisdications • Coordinated proposed work schedule for following week corridor wide • No conflicts or overlaps • Conformance with contract
Coordination • Web site and phone tree up to date • Constant interaction with local entities • Personal visits to affected neighborhoods • Personal visits to affected businesses • Photo-ready maps and materials • Respond to individual requests • Dedicated contractor staff to work out any issues • Hot line • Interactive • Could leave message or talk to ‘real’ person
How the Public is Informed • 60 % of Drivers get information from the Media • 15 % from the Internet • 9 % from UDOT • 3 % from I-15 Hotline (1-888-INFO-I15) • Only 7% don’t know where to get information • this number continues to decline
Deseret News/Dan Jones PollJuly 28, 1997 • 82% inconvenienced • 86% are well informed • 70% still agree with design/build decision
Corridor Traffic Conditions • 209,000 vehicles per weekday on I-15 in June, 1996 • Lane use of 17,400 vplpd in 12 lanes • 24 hour per day use • 12’ lanes, full shoulders • 93,500 vehicles per weekday on I-15 in June, 1999 • Lane use of 23,400 vplpd in four lanes • 16 hour per day use (closed 10 pm to 6 am) • 11’ lanes, 2’ shoulders • 115,500 vpwd displaced
Results • This indicated traffic was not entering local neighborhoods, as originally feared by residents • Parallel street projects provided route continuity and capacity • Public education informed motorists which routes were available