Download
1 / 19
290 likes | 915 Vues
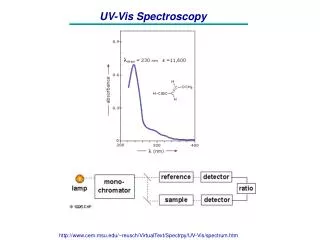
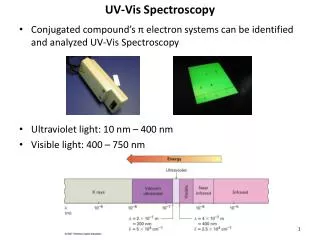
Applications of UV-Vis Spectroscopy. Lecture 28. 5. Analysis of Mixtures of Absorbing Substances When the sample solution contains more than one absorbing species, the absorbance of the solution will be the sum of all absorbances: A t = A 1 + A 2 + A 3 + ….

E N D
Applications of UV-Vis Spectroscopy Lecture 28
5. Analysis of Mixtures of Absorbing Substances When the sample solution contains more than one absorbing species, the absorbance of the solution will be the sum of all absorbances: At = A1 + A2 + A3 + …. The different constituents can be determined if we build equations equal to the number of unknowns. However, this procedure, if manually performed, is impractical due to lengthy and difficult math involved especially when more than two components are present. Remember that we need to calculate n2 values for e where n is the number of components. Al’ = ex’bcx + ey’bcy (1) Al” = ex”bcx + ey”bcy (2) ex’, ex”, ey’, ey” can be determined from standards of analytes x and y at l’, l” and values obtained are inserted in equations 1 and 2 where two equations in two unknowns can be easily solved.
6. Derivative UV-VisAbsorption Spectroscopy In derivative spectroscopy, DA/Dl is plotted against the wavelength. The derivative spectrum contains sharper peaks where better location of peaks and wavelengths maxima can be achieved. Not only the first derivative of the absorbance spectrum can be obtained but up to the fourth derivative is possible. However, as the differentiation order increases, the noise increases as well and if a lower derivative is fine, going to higher derivatives is a waste of time and effort. Derivative spectroscopy is excellent for determination of multi components in a sample, if they can be resolved.
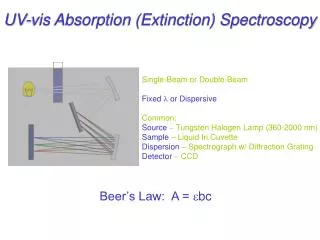
Obtaining a Derivative Spectrum Derivative spectra cab either be recorded on time or by manipulation of data obtained in an absorbance/wavelength spectrum. The later is easy and can be made by simple electronic or mathematic operations; by taking DA for a fixed Dl (few nm) and plotting the data versus wavelength. However, the most common on line instrumental recording of derivative spectra involves the use of a dual wavelength instrument with two monochromator operated at the same speed but with a lag of few nm from each other. A chopper will sequentially pass the beams from both monochromators and thus their difference divided by the constant nm lag value is recorded versus the average wavelength. The following schematic is helpful to visualize how this is accomplished:
Applications of Derivative Spectra • Better qualitative analysis and identification of the number of absorbing species in a sample • Accurate determination of lmax • Obtaining spectra in solutions with high scattering was possible using dual wavelength instruments • Spectral resolution of multi component systems by measurement at two wavelengths; where the interferent has identical molar absorptivity while the analyte does not, can result in good exclusion of interferences.
Photometric Titrations In cases where an analyte reacts with a reagent so that the analyte, the reagent or the product absorbs UV-Vis radiation, the technique can be used for determination of the analyte by a photometric titration reaction. Photometric titrations are similar to conventional visual titrations but following the course of a photometric titration occurs with the aid of a UV-Vis detector, rather than the naked eye.
Photometric Titration Curves A plot of absorbance versus titrant volume is called a photometric titration curve. The titration curve is supposed to consist of two linear lines intersecting in a point corresponding to the end point of the reaction. The absorbance reading should be corrected for volume where as a titrant is added to the reaction mixture the absorbance will change. Several shapes of photometric titration curves can be identified depending on the reaction.
Instrumentation A conventional photometer or spectrophotometer can be adapted to performing photometric titrations where the analyte is placed in the sample cell which contains a small magnet and is located on the top of a magnetic stirrer. The wavelength is selected and the titrant is added, from a dark burette, gradually and the absorbance is recorded.
Advantages and Applications of Photometric Titrations 1. Usually, photometric titrations are more accurate than visual titrations. 2. Photometric titrations are faster than visual titrations as only few points at the beginning and end of the titration is necessary. Extrapolation of the straight lines will intersect at the end point. 3. Titration reactions that are slow at the end point can not be performed by visual titrations but are well suited for photometric titrations. Only few points at the beginning and end of the titration, well away from the equivalence point where the reaction is slow, are necessary. Extrapolation of the straight lines will intersect at the end point. Therefore, dilute solutions or weak asids and bases can be also titrated photometrically. 4. Mixtures can be easily titrated using photometric titrations if absorbance is measured at the absorption wavelength of one of the two analytes. In addition, if both analytes give colored products but with different molar absorptivities, they can be determined photometrically.
For example, figure a below shows the EDTA titration of Bi3+ and Cu2+ at the wavelength of the Cu-EDTA where the Bi-EDTA does not absorb. Figure b shows a hypothetical reaction where two products absorb incident radiation. The first substance (x) reacts first and followed by the second one which has a lower molarabsorptivity .(