UV-VIS SPECTROSCOPY
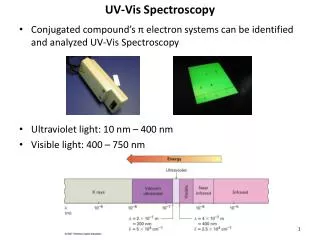
UV-VIS SPECTROSCOPY. Light interacting with matter as an analytical tool. Electronic Excitation by UV/Vis Spectroscopy :. UV: valance electronic excitation. Radio waves: Nuclear spin states (in a magnetic field). IR: molecular vibrations. X-ray: core electron excitation.

UV-VIS SPECTROSCOPY
E N D
Presentation Transcript
UV-VIS SPECTROSCOPY Light interacting with matter as an analytical tool
Electronic Excitation by UV/Vis Spectroscopy : UV: valance electronic excitation Radio waves: Nuclear spin states (in a magnetic field) IR: molecular vibrations X-ray: core electron excitation
Different Spectroscopies • UV-vis – electronic states of valence e/d-orbital transitions for solvated transition metals • Fluorescence – emission of UV/vis by certain molecules • FT-IR – vibrational transitions of molecules • FT-NMR – nuclear spin transitions • X-Ray Spectroscopy – electronic transitions of core electrons
Why should we learn this stuff?After all, nobody solves structures with UV any longer! Many organic molecules have chromophores that absorb UV UV absorbance is about 1000 x easier to detect per mole than NMR Still used in following reactions where the chromophore changes. Useful because timescale is so fast, and sensitivity so high. Kinetics, esp. in biochemistry, enzymology. Most quantitative Analytical chemistry in organic chemistry is conducted using HPLC with UV detectors One wavelength may not be the best for all compound in a mixture. Affects quantitative interpretation of HPLC peak heights
“hypsochromic” shift “bathochromic” shift Uses for UV, continued Knowing UV can help you know when to be skeptical of quant results. Need to calibrate response factors Assessing purity of a major peak in HPLC is improved by “diode array” data, taking UV spectra at time points across a peak. Any differences could suggest a unresolved component. “Peak Homogeneity” is key for purity analysis. Sensitivity makes HPLC sensitive e.g. validation of cleaning procedure for a production vessel But you would need to know what compounds could and could not be detected by UV detector! (Structure!!!) One of the best ways for identifying the presence of acidic or basic groups, due to big shifts in for a chromophore containing a phenol, carboxylic acid, etc.
The UV Absorption process • * and * transitions: high-energy, accessible in vacuum UV (max <150 nm). Not usually observed in molecular UV-Vis. • n * and * transitions: non-bonding electrons (lone pairs), wavelength (max) in the 150-250 nm region. • n * and * transitions: most common transitions observed in organic molecular UV-Vis, observed in compounds with lone pairs and multiple bonds with max = 200-600 nm. • Any of these require that incoming photons match in energy the gap corrresponding to a transition from ground to excited state. • Energies correspond to a 1-photon of 300 nm light are ca. 95 kcal/mol
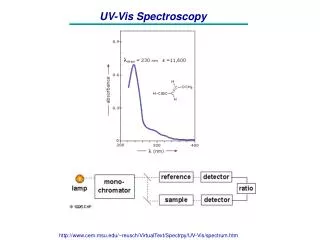
π* π* π* Example for a simple enone π* π* π* π* π* π* n n n π π π π π π -*; max=218 =11,000 n-*; max=320 =100 What are the nature of these absorptions? Example: * transitions responsible for ethylene UV absorption at ~170 nm calculated with ZINDO semi-empirical excited-states methods (Gaussian 03W): h 170nm photon LUMOg antibonding molecular orbital HOMOu bonding molecular orbital
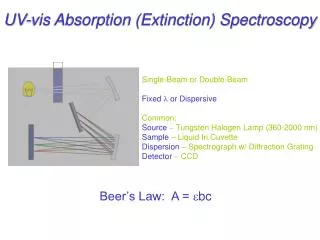
How Do UV spectrometers work? Rotates, to achieve scan Matched quartz cuvettes Sample in solution at ca. 10-5M. System protects PM tube from stray light D2 lamp-UV Tungsten lamp-Vis Double Beam makes it a difference technique Two photomultiplier inputs, differential voltage drives amplifier.
Diode Array Detectors Diode array alternative puts grating, array of photosens. Semiconductors after the light goes through the sample. Advantage, speed, sensitivity, The Multiplex advantage Disadvantage, resolution is 1 nm, vs 0.1 nm for normal UV Model from Agilent literature. Imagine replacing “cell” with a microflow cell for HPLC!
Experimental details What compounds show UV spectra? Generally think of any unsaturated compounds as good candidates. Conjugated double bonds are strong absorbers Just heteroatoms are not enough but C=O are reliable Most compounds have “end absorbance” at lower frequency. Unfortunately solvent cutoffs preclude observation. You will find molar absorbtivities in L•cm/mol, tabulated. Transition metal complexes, inorganics Solvent must be UV grade (great sensitivity to impurities with double bonds) The NIST databases have UV spectra for many compounds
1.0 maxwith certain extinction UV Visible Absorbance 0.0 400 800 200 Wavelength, , generally in nanometers (nm) An Electronic Spectrum Make solution of concentration low enough that A≤ 1 (Ensures Linear Beer’s law behavior) Even though a dual beam goes through a solvent blank, choose solvents that are UV transparent. Can extract the value if conc. (M) and b (cm) are known UV bands are much broader than the photonic transition event. This is because vibration levels are superimposed on UV.
Solvents for UV (showing high energy cutoffs) THF 220 CH2Cl2 235 CHCl3 245 CCl4 265 benzene 280 Acetone 300 Various buffers for HPLC, check before using. Water 205 CH3CN 210 C6H12 210 Ether 210 EtOH 210 Hexane 210 MeOH 210 Dioxane 220
Organic compounds (many of them) have UV spectra One thing is clear Uvs can be very non-specific Its hard to interpret except at a cursory level, and to say that the spectrum is consistent with the structure Each band can be a superposition of many transitions Generally we don’t assign the particular transitions. From Skoog and West et al. Ch 14
An Example--Pulegone Frequently plotted as log of molar extinction So at 240 nm, pulegone has a molar extinction of 7.24 x 10³ Antilog of 3.86
Can we calculate UVs? Semi-empirical (MOPAC) at AM1, then ZINDO for config. interaction level 14 Bandwidth set to 3200 cm-1
The orbitals involved Showing atoms whose MO’s contribute most to the bands
P0 (power in) P (power out) The Quantitative Picture • Transmittance: • T = P/P0 • Absorbance: • A = -log10 T = log10 P0/P B(path through sample) • The Beer-Lambert Law (a.k.a. Beer’s Law): • A =ebc • Where the absorbance A has no units, since A = log10 P0 / P • e is the molar absorbtivity with units of L mol-1 cm-1 • b is the path length of the sample in cm • c is the concentration of the compound in solution, expressed in mol L-1 (or M, molarity)
Beer-Lambert Law Linear absorbance with increased concentration--directly proportional Makes UV useful for quantitative analysis and in HPLC detectors Above a certain concentration the linearity curves down, loses direct proportionality--Due to molecular associations at higher concentrations. Must demonstrate linearity in validating response in an analytical procedure.
Quantitative Spectroscopy • Beer’s Law Al1 = el1bc e is molar absorptivity (unique for a given compound at l1) b is path length c concentration
cuvette slit source detector Beer’s Law • A = -logT = log(P0/P) = ebc • T = Psolution/Psolvent = P/P0 • Works for monochromatic light • Compound x has a unique e at different wavelengths
Characteristics of Beer’s Law Plots • One wavelength • Good plots have a range of absorbances from 0.010 to 1.000 • Absorbances over 1.000 are not that valid and should be avoided • 2 orders of magnitude
Standard Practice • Prepare standards of known concentration • Measure absorbance at lmax • Plot A vs. concentration • Obtain slope • Use slope (and intercept) to determine the concentration of the analyte in the unknown
UV-Vis Spectroscopy • UV- organic molecules • Outer electron bonding transitions • conjugation • Visible – metal/ligands in solution • d-orbital transitions • Instrumentation
Characteristics of UV-Vis spectra of Organic Molecules • Absorb mostly in UV unless highly conjugated • Spectra are broad, usually to broad for qualitative identification purposes • Excellent for quantitative Beer’s Law-type analyses • The most common detector for an HPLC
Molecules have quantized energy levels: ex. electronic energy levels. hv } energy energy = hv Q: Where do these quantized energy levels come from? A: The electronic configurations associated with bonding. Each electronic energy level (configuration) has associated with it the many vibrational energy levels we examined with IR.
Broad spectra • Overlapping vibrational and rotational peaks • Solvent effects
Molecular Orbital Theory • Fig 18-10
s* p* 2p 2p n p s s* 2s 2s s
Ethane max = 135 nm (a high energy transition) Absorptions having max < 200 nm are difficult to observe because everything (including quartz glass and air) absorbs in this spectral region.
= hv =hc/ Example: ethylene absorbs at longer wavelengths: max = 165 nm = 10,000
The n to pi* transition is at even lower wavelengths but is not as strong as pi to pi* transitions. It is said to be “forbidden.” Example: Acetone: n max = 188 nm ; = 1860 n max = 279 nm ; = 15
135 nm 165 nm n 183 nm weak 150 nm n 188 nm n 279 nm weak 180 nm A 279 nm
Conjugated systems: Preferred transition is between Highest Occupied Molecular Orbital (HOMO) and Lowest Unoccupied Molecular Orbital (LUMO). Note: Additional conjugation (double bonds) lowers the HOMO-LUMO energy gap: Example: 1,3 butadiene: max = 217 nm ; = 21,000 1,3,5-hexatriene max = 258 nm ; = 35,000
Similar structures have similar UV spectra: max = 240, 311 nm max = 238, 305 nm max = 173, 192 nm
max = 114 + 5(8) + 11*(48.0-1.7*11) = 476 nm max(Actual) = 474.
Polyenes, and Unsaturated Carbonyl groups;an Empirical triumph R.B. Woodward, L.F. Fieser and others Predict max for π* in extended conjugation systems to within ca. 2-3 nm. Attached group increment, nm Extend conjugation +30 Addn exocyclic DB +5 Alkyl +5 O-Acyl 0 S-alkyl +30 O-alkyl +6 NR2 +60 Cl, Br +5 Homoannular, base 253 nm Acyclic, base 217 nm heteroannular, base 214 nm
b b O x Similar for Enones 227 239 202 215 Base Values, add these increments… b g d,+ X=H 207 X=R 215 X=OH 193 X=OR 193 With solvent correction of….. Water +8 EtOH 0 CHCl3 -1 Dioxane -5 Et2O -7 Hydrcrbn -11
Some Worked Examples Base value 217 2 x alkyl subst. 10 exo DB 5 total 232 Obs. 237 Base value 214 3 x alkyl subst. 15 exo DB 5 total 234 Obs. 235 Base value 215 2 ß alkyl subst. 24 total 239 Obs. 237
Distinguish Isomers! Base value 214 4 x alkyl subst. 20 exo DB 5 total 239 Obs. 238 Base value 253 4 x alkyl subst. 20 total 273 Obs. 273
Generally, extending conjugation leads to red shift “particle in a box” QM theory; bigger box Substituents attached to a chromophore that cause a red shift are called “auxochromes” Strain has an effect… max 253 239 256 248
Interpretation of UV-Visible Spectra • Transition metal complexes; d, f electrons. • Lanthanide complexes – sharp lines caused by “screening” of the f electrons by other orbitals • One advantage of this is the use of holmium oxide filters (sharp lines) for wavelength calibration of UV spectrometers. See Shriver et al. Inorganic Chemistry, 2nd Ed. Ch. 14
Benzenoid aromatics UV of Benzene in heptane From Crewes, Rodriguez, Jaspars, Organic Structure Analysis
Substituent effects don’t really add up Can’t tell any thing about substitution geometry Exception to this is when adjacent substituents can interact, e.g hydrogen bonding. E.g the secondary benzene band at 254 shifts to 303 in salicylic acid In p-hydroxybenzoic acid, it is at the phenol or benzoic acid frequency
Heterocycles Nitrogen heterocycles are pretty similar to the benzenoid anaologs that are isoelectronic. Can study protonation, complex formation (charge transfer bands)
Quantitative analysis Great for non-aqueous titrations Example here gives detn of endpoint for bromcresol green Binding studies Form I to form II Isosbestic points Single clear point, can exclude intermediate state, exclude light scattering and Beer’s law applies Binding of a lanthanide complex to an oligonucleotide
More Complex Electronic Processes • Fluorescence:absorption of radiation to an excited state, followed by emission of radiation to a lower state of the same multiplicity • Phosphorescence:absorption of radiation to an excited state, followed by emission of radiation to a lower state of different multiplicity • Singlet state:spins are paired, no net angular momentum (and no net magnetic field) • Triplet state:spins are unpaired, net angular momentum (and net magnetic field)