Download
1 / 20
200 likes | 556 Vues
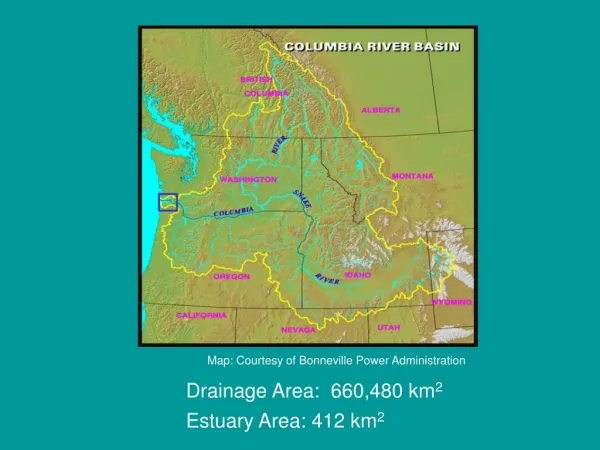
Three Second Gust Extreme Wind Speed Map, CP2363. IEEE. Leon Kempner, Jr., P.E. Bonneville Power Administration February 6, 2000. Why Change Rule 250C?. Current Extreme Wind Map, Based on Fastest Mile Wind Speed

E N D
Three Second Gust Extreme Wind Speed Map, CP2363 IEEE Leon Kempner, Jr., P.E. Bonneville Power Administration February 6, 2000
Why Change Rule 250C? • Current Extreme Wind Map, Based on Fastest Mile Wind Speed • New wind data and engineering wind maps are based on Three (3) Second Gust extreme Wind Speed • Fastest Mile wind speed, no longer collected • Three Second Gust speed collected at more stations • The Three Second Gust Wind Speed was first presented in ASCE 7-95
Why Change Rule 250C? (Continued) • The Three Second Gust Wind Speed represents a better database and analysis of available data • The NESC should be consistent with other Engineering Loading Standards, Guides and Codes such as, ASCE-7, EIA/TIA-222, ASCE-74, IBC, etc. • This change is the right thing to do, Standard/Engineering Creditability
Database/Analysis • Continental Winds:è485 weather stations, min. 5 years of dataèData was assembled from a number of stations in state-size areas to reduce sampling errorsèFisher-Tippett Type I extreme value distribution, 50 year return periodèInsufficient variation in peak gust wind speeds to justify contoursè33 ft. above ground, Exposure C
Database/Analysis • Hurricane Winds:èBased on Monte-Carlo simulationsèThe coastline was divided into discrete points spaced at 50 nautical miles.èHurricane contours over the Atlantic are provided for interpolations and represent values for Exposure C over land.èImportance factors are accounted for in the map wind speeds, >1.0 at the coast to 1.0, 100 miles inland.
Fastest Mile Vs. 3 Sec. Gust FASTEST MILE SPEED 3 SECOND GUST SPEED
Gust Response Vs Gust Factors • GRF - Accounts for Dynamic effects of gusts on the response of T-line components- Gusts may not envelop the entire span between T-line Structures- Values can be Greater than or Less than 1.0- Represents the ratio of peak gust load effect to the selected mean extreme load effect
Gust Response Vs. Gust Factors • Gust Factor- The Ratio of the gust extreme wind speed at a specified averaging period, e.g. 2 seconds, to the selected mean extreme wind speed, e.g. 10 minute.- Used as a multiplier of the mean extreme wind speed to obtain the gust wind speed.- Values Greater than 1.0 (Typ. 1.1 - 1.5)
NESC Extreme Wind Format CP2363 • EquationslFigureslTables
Gust Response Factor, GRF • Davenport Equations, “Gust Response Factors for Transmission Line Loading,” Proceeding, 5th International Conference on Wind Engineering, 1979 • ASCE 74, “Guidelines for Electrical Transmission Line Structural Loading,”1991 • ASCE 7, “Minimum Design Loads for Buildings and Other Structures,” 1995 • IEC 826, “Loading and Strength of Transmission Lines,” 1991
3 Second Gust Wind Pressure qZ = 0.00256 * kZ * V2 * I * GRF * Cd Where: kZ - Velocity Pressure Exposure Coefficient, C, as defined in Rule 250C.1, Table 250-2.V - Basic Wind Speed, 3-second gust wind speed, miles per hour, at 33 ft. above ground, an annual probability of 0.02 (50 year return period), Figure 250-2.sI - Importance Factor, 1.0 for structures, wires, and their support facilities.GRF - Gust Response Factor, as defined in Rule 250C.2.Cd - Shape Factor, as defined in Rule 252B.
Table Values Represent a Uniform Change 3% 7% 7% 4% 3% 4% 3%
Tables of Factors Structure/Wire Gust Response Factors 1. Recommend General Equations for tower height, h, greater than 250 ft. and span length, L, greater than 2000 ft. Velocity Pressure Exposure Coefficients 1. Recommend General Equation for height greater than 250 ft.
General Equations Structure/Wire Gust Response Factors Structure GRF = (1 + 2.7*ES (BS)0.5)/kV2 Wire GRF = (1 +2.7 *EW (BW)0.5)/kV2 ES = 0.346*(33/(0.67*h))1/7 EW = 0.346*(33/h)1/7 BS = 1/(1+0.375*h/220) BW = 1/(1+0.8*L/220) E = Exposure Factor B = Dimensionless response term corresponding to the quasi-static background wind load kV = 1.430 Velocity Pressure Exposure Coefficients Structure kZ = 2.01*(0.67*h/900) (2/9.5) Wire kZ = 2.01*(h/900) (2/9.5) (for 15 ft. £ h £ 900 ft.)
Example CP2363 C2-1997 qZ = 0.00256*kZ*V2*I*GRF*Cd qZ = 0.00256*V2*Cd qZ = 0.00256*kZ*V2 *GRF*(I*Cd) qZ = 0.00256*V2*C qZ = 0.00256*kZ*V2 *GRF*C 7Ì Wind in Tower (Height 141 ft.) 70 mph À 12.54C 80 mph À 16.38C 90 mph À 20.74C 25Ì Kz Twr GRF 141 ft. 1.30 0.859 25Ì Wind in Wire (1000 Ft. Span) 10Ì Kz Wire GRF 75Ì Note: No Gust Factor 74 ft. 1.20 0.712 99 ft. 1.30 0.698 124 ft. 1.40 0.687 141 ft. 1.40 0.687 9Ì
Example (Continued) CP2363 Tower Wind Pressure @ 141 ft. = 0.00256*1.3*(90mph)2*0.859*C = 23.2C psf Wire Wind Pressure @ 74 ft. = 0.00256*1.2*(90mph)2*0.712*C = 17.7C psf @ 99 ft. = 0.00256*1.3*(90mph)2*0.698*C = 18.8C psf @ 124 ft. = 0.00256*1.4*(90mph)2*0.687*C = 19.9C psf @ 141 ft. = 0.00256*1.4*(90mph)2*0.687*C = 19.9C psf
Example (Continued) C2 20.7C á CP 19.9C á C2 psf CP psf C2 20.7C á CP 19.9C á C2 20.7C á CP 18.8C á C2 20.7C á CP 23.2C á C2 20.7C á CP 17.7C á
Review of CP2363 • Presents the 3 second gust extreme wind speed approach • Updates the NESC extreme wind speed map to current wind engineering knowledge • Presents statistically better wind speed data • Technically correct/consistent approach for determining wind loading