QlikView
QlikView. Using Qlikview for Student Reporting : A case study of the implementation of an innovative reporting tool in an HEI Mike Frost, Assistant Director of Finance & David Davies, Director of Student Data and Funding. QlikView. A New Generation of Reporting on

QlikView
E N D
Presentation Transcript
QlikView Using Qlikview for Student Reporting : A case study of the implementation of an innovative reporting tool in an HEI Mike Frost, Assistant Director of Finance & David Davies, Director of Student Data and Funding
QlikView A New Generation of Reporting on Student Registrations and Applications Mike Frost Assistant Director of Finance
Reporting Systems • Before • We have always held significant quantities of data • Often this data has been ‘locked’ away in systems and was difficult to extract • The extraction process was complex and often required specialist knowledge of the system • It was difficult to ensure that data was consistently extracted • Consequently little use was made of existing data
Reporting Systems • After • We still hold significant quantities of data • This data has now been ‘unlocked’ – we have developed a data hungry culture. • End users can now utilise powerful reporting capabilities to extract data without the need for specialist knowledge. • We have now achieved ‘One version of the truth’ and ease of use. • We now have easy access to information which supports our University in achieving its corporate objectives
Reporting Systems • Solution • We were looking for a product that empowered our staff. • Which offered a phased approach to implementation. • Where value was quickly delivered to our University. • Where implementation time was minimal. • With an ability to support our University in a rapidly changing environment. • With minimal project risk.
How did we discover QlikView ? • During a routine visit from one of our software suppliers (BME Solutions) we received a brief demo. • BME believed that it may be of interest for financial reporting as it had in most of the customer base. • We immediately saw its potential as a student reporting tool.
How long did implementation ofQlikView take ? • We purchased the software at the end of May 2008. • We had created a draft model using ‘flat file’ input within 24 hours. • We developed our models and incorporated ODBC links into our data sources during June 2008.
Project Vision / Goal QlikView Approach • Phased Approach Enables… • Value quickly delivered to organization • Reduced time to market of applications • Ability to react to changing business needs • Maintain involvement, commitment and adoption by business and IT • Mitigation of project risk Traditional BI Approach “Big Bang” Time
Why QlikView? • We have looked at the market for many years and considered BI solutions from a number of suppliers. • All these products were expensive and complex to implement. • They require significant technical support from specialist IT departments and often require bespoke reports to be written each time an end user wants some variation on the reports. • QlikView enables the end user to analyse the data on the desktop without the need to be skilled in the use of database interrogation products.
Canons of Data • One version of the truth - SITS, Agresso etc. • Readily available, regularly updated on the desktop - QlikView • Dashboard indicators for KPIs - QlikView • Familiarity and ease of use - QlikView • Fit for purpose
Reporting Systems • QlikView is an innovative tool that enables staff to interrogate student application and registration data. • Output is provided in both graphical and tabular formats and enables users to carry out complex analysis of data through a user-friendly interface. • This development has revolutionised the way in which we can monitor our key statistical data sources as well as the level of information available to staff. • Corporate Dashboards can be integrated within each model.
QlikView A New Generation of Reporting on Student Registrations and Applications David Davies Director of Student Data and Funding (Returns)
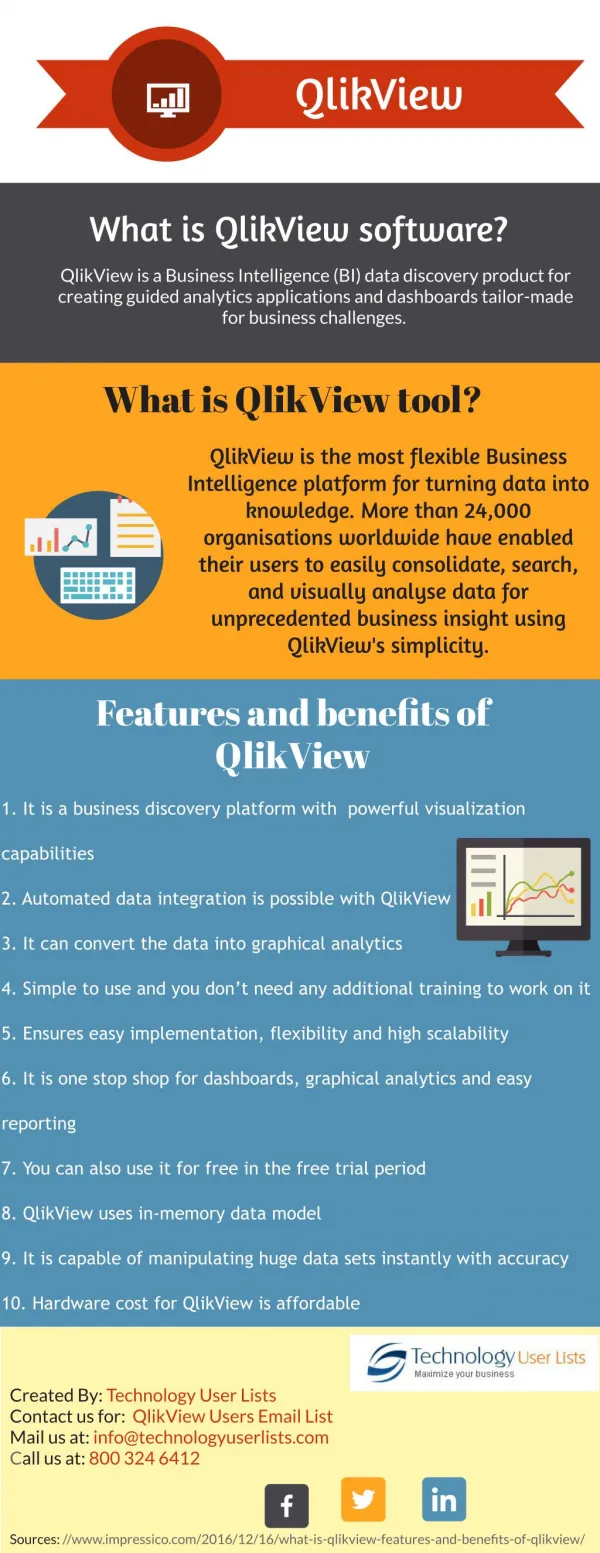
What is QlikView? • QlikView is a sophisticated Business Intelligence (BI) reporting tool which is capable of reporting in both graphical and tabular formats. • It enables analysis capabilities that are unthinkable in traditional technologies -along with unparalleled flexibility, performance, and simplicity. • The models we will be looking at today were developed at Anglia Ruskin University by a small team headed up by Mike Frost, Assistant Director of Finance. • They have been developed using ODBC links into the SITS database extracts.
Who uses QlikView? • QlikView has more than 500,000 users in 92 countries, over 10,700 customers, and continues to add an average of 270 customers every month. • We are the first University both in the UK and worldwide to develop a solution to our student reporting needs using this tool.
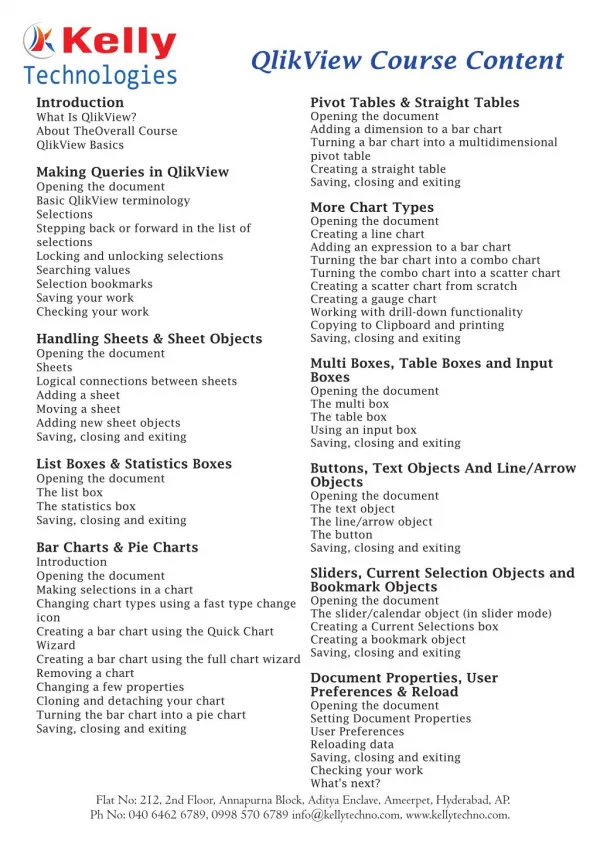
We can look at student registrations by :- Faculty Department Programme Funding Source Mode of Study Ethnicity Domicile Home Post Code And many more … We can look at student applications by :- Faculty Department Programme Funding Source Mode of Study Decision Status Domicile Home Post Code And many more … What Analysis Can I Perform?
Conclusion • We have made significant improvements in our reporting solutions in the past year. • Further solutions currently being developed are :- • Predictive statistics for Admissions • Financial Dashboard • Space Database • HR Statistics • Debtor Analysis • Having made this progress we must use the improved information to our advantage and pursue our vision.
Who Has Access? • In phase one of the implementation we have provided access to :- • Vice Chancellors Group (VCG) • Corporate Management Team (CMT) • Associate/Deputy Deans • Heads of Academic Department • Faculty Resource Managers • Financial Services Staff • IT Staff
How was training provided? • We provided training on a half day workshop basis. • At the workshop there was a demonstration of the product and its capabilities. • Attendees were then given an opportunity to practice using our QlikView model with facilitators at hand to provide one to one assistance.
Demonstration • Mike will now demonstrate the product to give you an indication of the ease of use and power of the reporting capabilities. • If you have any queries about this demonstration please e-mail :- • Mike Frost (Anglia Ruskin University) - mike.frost@anglia.ac.uk • David Davies (Anglia Ruskin University) -david.davies@anglia.ac.uk • or alternatively Steve Sapseid (BME Solutions Ltd.)ssapseid@bmesol.com.