QlikView
QlikView . Associative Thought driven Natural Freeing Flexible Collaborative Personal Empowering. Patented In Memory Associative Technology. What. How. The power of simplicity. In Memory Fast Light impact Visually Interactive Summary and Detail Portable Simple Inexpensive


QlikView
E N D
Presentation Transcript
Associative Thought driven Natural Freeing Flexible Collaborative Personal Empowering Patented In Memory Associative Technology What How The power of simplicity • In Memory • Fast • Light impact • Visually Interactive • Summary and Detail • Portable • Simple • Inexpensive • Integrative QlikView Real-time OLAP “Real-time processing” Memory & Processor Power 64 Bit Traditional Cube OLAP “Pre-processing” Time
Everyone Else “Fast Deployment” “Easy-to-Use” Powerful” “Flexible” “Revolutionary” QlikView New Rules Within two days of downloading a trial version of QlikView, Shell Sweden had a prototype application for analyzing financial data. It became a customer and later expanded QlikView usage to sales and operations functions. A Nacka kommun representative emphasized how user friendly QlikView was, stating, "It is so easy to work with it seems like fun." Dakota Healthcare built an application to allow users to navigate through massive amounts of related data to each insurance claim. The 200GB database was compressed into 500MB and loaded into the RAM of a 64-bit Windows Server 2003. Zurich, a Swiss insurance firm, was able to reduce the workload of report development and maintenance from seven full-time dedicated staff to two people working over a two- to three-day period every month. IDG Denmark chose to download a trial of QlikView and had some initial skepticism about the low cost of the solution. However, due to the ease of implementation and functionality, IDG soon became a satisfied, paying customer. Deluca Homes, a manufacturer of homes turned to QlikView to provide: applications that enable monitoring of the performance of contractors involved in the building and inspection of homes, provision of KPIs to management, and analysis of financial data. Our Value Proposition: 1/4 the time, 1/2 the cost, 2x the value Source: IDC whitepaper by Dan Vesset and Brian McDonough, “QlikTech’s Approach to Business Intelligence: Keep It Simple and Flexible”
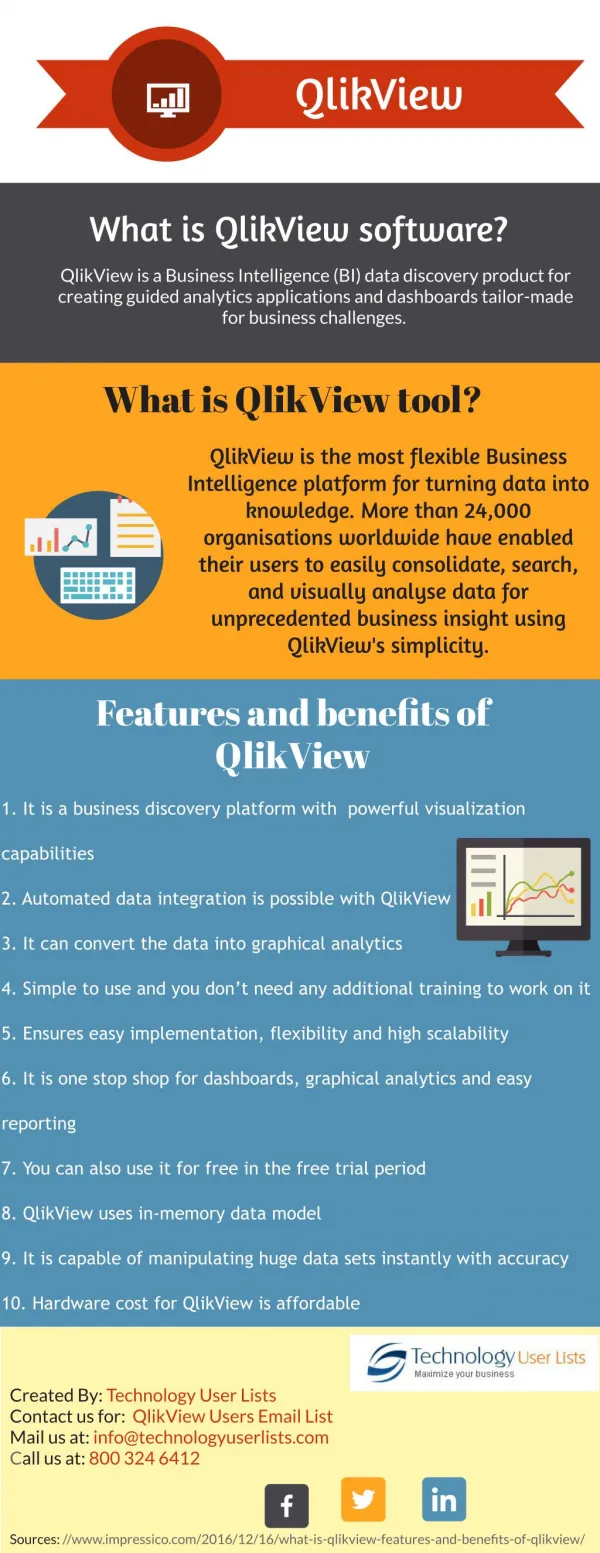
What makes QlikView special, on need to know basis? QlikView is a « new generation » tool: All data are stored in memory and processed from there faster! • Traditional generation BI tools working with views Makes associative connections like human brain: no top-down, no data structure knowledge required ... PC: 3 versions 8.5 very recent update to 9 Analyser (only consult reports) Professional: also creation of reports, chart, etc (advanced users) Developer: also create datawarehouse etc (IT) Server: on a windows server Server Publisher (most expensive license, not for SMEs)
What can you do met QlikView? • Create flexible end user interface for DW • View on relations between data • Make presentations, based on your data • Cretae dynamic graphs and tables • Perform statistical analysis • Link descriptions and multimedia to data • Sert up your own expert system • Create new tables and merge information from different sources • Build your own BI system
Communities etc • www.qlikcommunity.com Links to qlikacademy with videos, courses, etc • demo.qliktech.com Several applications • Belgian distributor: Credon (Tessenderlo) www.credon.be
Using QlikView Professional • Starting QlikView • Basic Layout and Navigation Remember, a QlikView file contains everything the user needs to perform meaningful data analysis, including the data itself and all the layout information, objects and sheets defined by the Professional developer
Wat strikes you? Colors: selected data green associated data white unrelated data grey Context help Help topics View Toolbars menus tabs Toolbar: design table relations (data structure) Sheet is the basis: right click sheet objects
Sheets and Sheet Objects • Sheet Basics A QlikView document uses at least one sheet on which sheet objects are displayed. Even if a number of sheet objects have been placed on several different sheets, all sheet objects are still fully connected by the QlikView logic.
Sheets and Sheet Objects • Sheet Objects Include: List Boxes Statistics Boxes Multi Boxes Table Boxes Charts Input Boxes Current Selections Boxes Buttons Text Objects Line/Arrow Objects Slider/Calendar Objects Bookmark Objects Custom Objects System Tables
Add sheet (via Layout) (or button) Sheet properties List box: select fields: Layout – Select fields Shift click Ctrl click
Activate a sheet object: click caption Move a sheet object on a sheet: click and drag Resize sheet object: like windows Copy on same sheet: ctrl click and keep caption -- drag – loose ctrl and mouse Move to another sheet: click hold and drag to tab Delete: via right mouse click or click caption and press delete button
First exercises 1 Open file Film and save as Film2 2 Create a new tab, copying Qvgids and name it « IP » 3 Create a box « current selections»
The List Box • The List Box is the most common QlikView object. List of all possible distinct values of a field one value represents multiple rows in source data • It provides one of the simplest ways of making a query and can also be used to navigate in QlikView
The List Box: Additional Functionality • Performing a simple search A value: green other table’ values whit or grey • Performing an advanced search Search String: click in caption (hoofding) – wildcards * and ? Select excluded (e.g. all customers without “er”) right mouse click • Create new list box: right mouse click • CTRL-Click: multiple selections • Simultaneous selections in multiple list boxes like AND • Locking (= clear proof; blue, yellow) and Unlocking Selections Lock button • Beacons: green blue red dot: indicates selection in other tab
List boxes exercise 1 Create a list box for movie title and another for year 2 Experiment with the settings
The Table Box - Tabelobject The Table Box is a sheet object that shows several fields simultaneously It is a combination of list boxes. Instead of placing each field in its own object separately, however, the Table Box combines them. The content of every row is logically connected. The columns may be fetched from different input tables, letting the user create tables from any possible combination of input tables. When you want to present the contents of several list boxes in one table, you need a Table Box to view data on detailed level not really for graphs or selections
The Table Box • A series of List Boxes presented in comparison with the Table Box
Table box Make table wider Widen a column Select in table selection in other tab green dot (beacon) click in table: one column, a second one, etc Sort drag caption: sequence columns on a column value: right click and sort Or via properties sort Export to Excel To QV export file
The Table Box: Advantages Some advantages of Table Boxes include: Making selections Sorting Printing Exporting
Table box exercises 1 Make a table box with actor, director and year 2 Sort decreasing on year and change sequence actor-director 3 Give it style « pyjama green » 4 Make a listbox of rating 5 Pick rating 6 and search in table box which movies from Donald Sutherland have that rating; 6 Export the result to QVO file and try to open from Excel
The Multi Box The Multi Box offers the ultimate solution to the problem of displaying a large number of list boxes on the same sheet. The Multi Box is a set of dropdown list boxes gathered within the same frame. As the picture illustrates, every field is represented by a row in the multi box. Multiple fields can be combined into a single Multi Box. Compare the space used for the list boxes with the Multi Box
The Multi Box: Advantages Less space is required in the layout. Less clutter Possible to display a large number of fields in a single Multi Box Displays the result of selections that result in a one-to-one relationship, since no data is shown until the selections define a single result in a Multi Box field
Multi Box 1 Make a multibox with Reference, language and title 2 Experiment with the settings
The Text Object Text objects are used for adding information to a QlikView document. They can be used to show text information or an image in the layout. They can be moved and positioned anywhere on a sheet, just like any other sheet object. Text objects can also be used effectively for displaying the results of calculations, and to create backgrounds. Think of a Text object as a blank object for content. You can use it to create an introduction page for your QlikView application, or simply to display the data model that supports your analysis. Text objects can also be used for pictures and can also contain calculations
The Text Object Examples
The Text Object Don’t exagerate because higher visual complexity 1 Create a text object in purple with your name as a header and in the object a picture of a turtle 2 Make a second text object containing the data model of the tables
Charts • Close Film2 and open OnlineSales • Create a new tab « grahs » and make the background white • Create two list boxes: CustomerName and SalesAmount
Charts Charts are a collection of graphical objects that can display one or several expressions plotted over one or several dimensions, such as ”Orders Per Year." In QlikView, you will recognize the most common chart types: bar, line and pie charts, but several other types, including two kinds of tables, are also included as charts. Icon Quick chart wizard or right click new sheet object chart
Charts Dimension: customer x-axe Expression: sales y-axe Fast type change e.g. sales person line sales amount Statistical trend lines (in expressions) Max visible number (presentation tab) Reference (France, then Canada) Drill down: click on bar
Charts: Common Types Chart Types: Bar Line Combo Radar Gauge Scatter Grid Pie Funnel Block Pivot (table) Straight (table)
Charts: Set Reference In many cases, it is useful to compare chart data for different selections. For this purpose, you can use chart reference The reference in the example shows the sales of men’s footwear in light blue behind the currently selected women’s footwear sales
Drilldown Chart with product drilldown, region drilldown, etc Powerful!
Charts exercises 1 Create a pie chart with a legend for total sales per product 2 Ensure the legend has % 3 Provide a suitable title and ensure that it can switch to bar chart 4 Only display top 5 5 Put the Y-value in the chart
Multidimensional Charts, Tables Multidimensional charts contain, as the name implies, more than one dimension. In a multidimensional chart, we might combine Year (the time dimension) with Country to analyze sales from year-to-year. We will also explore an as yet unexplored chart-type, the Pivot Table.
Multidimensional Charts, Tables Pivot Tables may also be used without any expressions to show a hierarchy of fields.
Example with straight table and then pivot table Dimension country Expression sum salesamount extra expression avg salesamount Only 2 countries Summary per year and quarter extra dimensions First pivot table conversion Only sum, deactivate avg In presentation show partial sums for three dimensions Other sequence: drag and drop
Multidimensional Charts, Tables • Visual Cues (like conditional formatting in Excel)
Multidimensional Charts, Tables: Exercises 1 Create a multidimensional table: per year the number of orders, nr of customers and total sales Use cilinders in the chart, values on top of each cilinder and change colors. Use a title in a nice layout 2 Create a pivot table with total sales per customer, product group and year and make it in style « pivot1 » 3 Make a straight table for sales, cost and margin and use two decimals for margin. Use visual cues for margin