Download
1 / 1
10 likes | 101 Vues
Wageningen-IMARES Institute for Marine Resources and Ecosystem Studies. Schematic of protocol. 25 m. >>25 m. Patch distance < 25 m:. Cover > 5% is determinant. 25 m. Cover = Sum area / area inside line. Norbert Dankers, André Meijboom Elze Dijkman IMARES - Texel

E N D
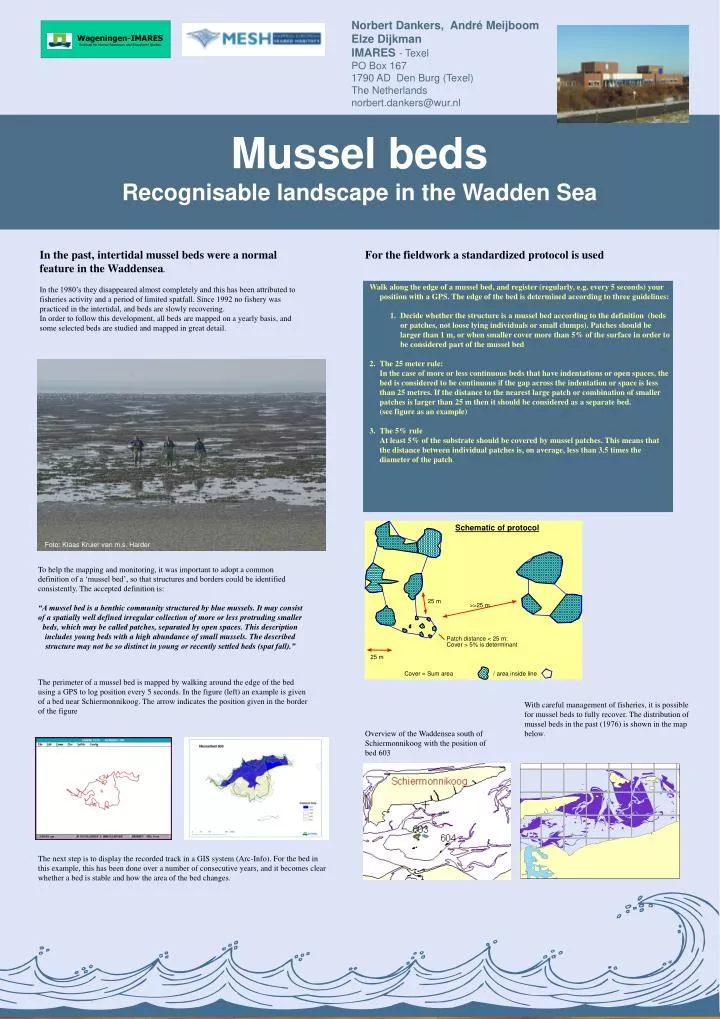
Wageningen-IMARES Institute for Marine Resources and Ecosystem Studies Schematic of protocol 25 m >>25 m Patch distance < 25 m: Cover > 5% is determinant 25 m Cover = Sum area / area inside line Norbert Dankers, André Meijboom Elze Dijkman IMARES - Texel PO Box 167 1790 AD Den Burg (Texel) The Netherlands norbert.dankers@wur.nl Mussel beds Recognisable landscape in the Wadden Sea In the past, intertidal mussel beds were a normal feature in the Waddensea. In the 1980’s they disappeared almost completely and this has been attributed to fisheries activity and a period of limited spatfall. Since 1992 no fishery was practiced in the intertidal, and beds are slowly recovering. In order to follow this development, all beds are mapped on a yearly basis, and some selected beds are studied and mapped in great detail. For the fieldwork a standardized protocol is used • Walk along the edge of a mussel bed, and register (regularly, e.g. every 5 seconds) your position with a GPS. The edge of the bed is determined according to three guidelines: • Decide whether the structure is a mussel bed according to the definition (beds or patches, not loose lying individuals or small clumps). Patches should be larger than 1 m, or when smaller cover more than 5% of the surface in order to be considered part of the mussel bed • 2. The 25 meter rule: • In the case of more or less continuous beds that have indentations or open spaces, the bed is considered to be continuous if the gap across the indentation or space is less than 25 metres. If the distance to the nearest large patch or combination of smaller patches is larger than 25 m then it should be considered as a separate bed. • (see figure as an example) • 3. The 5% rule • At least 5% of the substrate should be covered by mussel patches. This means that the distance between individual patches is, on average, less than 3.5 times the diameter of the patch. Foto: Klaas Kruier van m.s. Harder To help the mapping and monitoring, it was important to adopt a common definition of a ‘mussel bed’, so that structures and borders could be identified consistently. The accepted definition is: “A mussel bed is a benthic community structured by blue mussels. It may consist of a spatially well defined irregular collection of more or less protruding smaller beds, which may be called patches, separated by open spaces. This description includes young beds with a high abundance of small mussels. The described structure may not be so distinct in young or recently settled beds (spat fall).” The perimeter of a mussel bed is mapped by walking around the edge of the bed using a GPS to log position every 5 seconds. In the figure (left) an example is given of a bed near Schiermonnikoog. The arrow indicates the position given in the border of the figure With careful management of fisheries, it is possible for mussel beds to fully recover. The distribution of mussel beds in the past (1976) is shown in the map below. Overview of the Waddensea south of Schiermonnikoog with the position of bed 603 The next step is to display the recorded track in a GIS system (Arc-Info). For the bed in this example, this has been done over a number of consecutive years, and it becomes clear whether a bed is stable and how the area of the bed changes.